

WPF Debugging and Performance Succinctly®

CHAPTER 1
Debugging is one of the most important tasks in the application development lifecycle, representing the process of investigating for errors and of analyzing an application’s execution flow over an object’s state. Of course, this is true for all development environments and platforms, not just WPF. In the case of WPF, you use Visual Studio and its powerful debugger and instrumentation in order to improve your code quality. This short chapter explains what you will need to debug a WPF application and a number of concepts also follow in the next chapters.
Note: Debugging a WPF application involves using tools that are also available to other development platforms, such as Windows Forms and ASP.NET. If you already have experience with debugging in Visual Studio, this chapter (and the next two chapters) will explain concepts and techniques with which you might already be familiar. However, I’ll describe new debugging features in Visual Studio 2015 and 2017; I will also show how to fully leverage tools and functionalities—so keep an eye on the first three chapters.
Debugging an application in Visual Studio means starting your project with an instance of the debugger attached, which you perform simply by pressing F5 or Start on the standard toolbar. When you do this, Visual Studio compiles your solution and starts the resulting output (an .exe file in case of WPF) by attaching the debugger.
Tip: You can press Ctrl+F5 to start the application without the debugger attached.
Before you press F5, you must make sure the Debug configuration has been selected for compilation. This can be done by selecting Debug in either the Solution Configuration combo box in the toolbar or in the Configuration Manager window (see Figure 1) that you can reach by selecting Build, Configuration Manager.
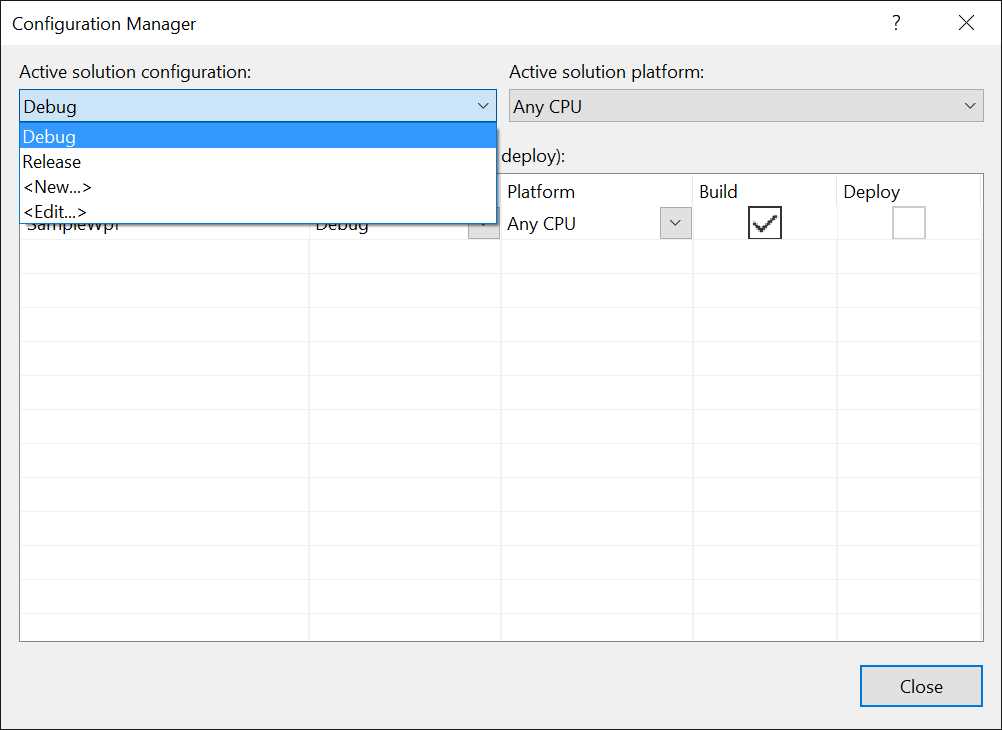
Figure 1: The Configuration Manager Dialog
Without these symbols, the debugger will not be able to collect the necessary information from your code, and the resulting experience will be very poor. Symbols are not generated when you select the Release configuration, and this makes sense because it means you have finished debugging and you are ready to distribute your application. Now, let’s prepare an example.
In order to understand how both the debugger and the integrated debugging tools in Visual Studio work, let’s work with a sample application. And because the focus is on the tooling, not the code, we do not need a complex project. First, in Visual Studio, we select File, New Project. In the New Project dialog, select the WPF Application template (see Figure 2), name the new project SampleWpf, and click OK.
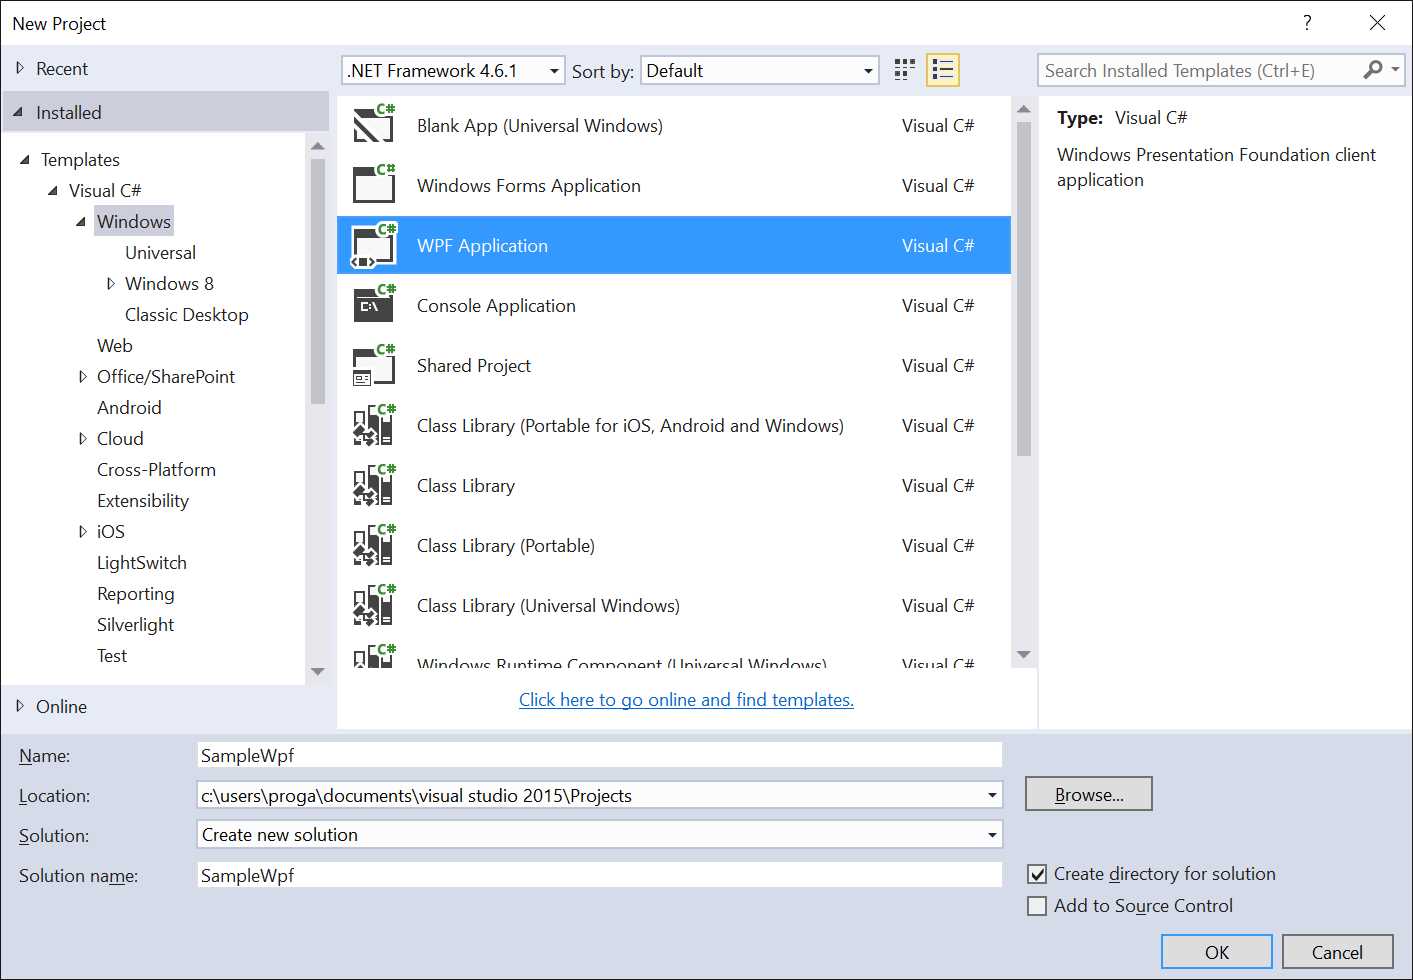
Figure 2: Creating a WPF Project
The goal of the sample application is to open a text file, which allows the user to select the file name. This much is enough to demonstrate many debugging features. Of course, more specific examples will be created when necessary. Based on this, the XAML code for the user interface is shown in Code Listing 1, while the code-behind is shown in Code Listing 2.
Code Listing 1
<Window x:Class="SampleWpf.MainWindow"
        xmlns="http://schemas.microsoft.com/winfx/2006/xaml/presentation"
        xmlns:x="http://schemas.microsoft.com/winfx/2006/xaml"
        xmlns:d="http://schemas.microsoft.com/expression/blend/2008"
        xmlns:mc="http://schemas.openxmlformats.org/markup-compatibility/2006"
        xmlns:local="clr-namespace:SampleWpf"
        mc:Ignorable="d"
        Title="MainWindow" Height="350" Width="525">
    <Grid>
        <Grid.RowDefinitions>
            <RowDefinition Height="40"/>
            <RowDefinition/>
        </Grid.RowDefinitions>
        <StackPanel Orientation="Horizontal" VerticalAlignment="Center">
            <TextBlock Text="Enter file name: "/>
            <TextBox x:Name="FileNameBox" Width="200" />
            <Button Width="100" Height="30" Content="Browse" x:Name="BrowseButton" Click="BrowseButton_Click"/>
            <Button Width="100" Height="30" Content="Open" x:Name="OpenButton" Click="OpenButton_Click"/>
        </StackPanel>
        <TextBox x:Name="ContentBox" Grid.Row="1" />
    </Grid>
</Window>
Code Listing 2
using Microsoft.Win32;
using System.IO;
using System.Windows;
namespace SampleWpf
{
    /// <summary>
    /// Interaction logic for MainWindow.xaml.
    /// </summary>
    public partial class MainWindow : Window
    {
        public MainWindow()
        {
            InitializeComponent();
        }
        private void OpenButton_Click(object sender, RoutedEventArgs e)
        {
            if (!string.IsNullOrEmpty(this.FileNameBox.Text))
            {
                this.ContentBox.Text = OpenFile(this.FileNameBox.Text);
            }
        }
        private string OpenFile(string fileName)
        {
            return File.ReadAllText(fileName);
        }
        private void BrowseButton_Click(object sender, RoutedEventArgs e)
        {
            var openDialog = new OpenFileDialog();
            openDialog.Title = "Select a .txt file";
            openDialog.Filter = "Text files (.txt)|*.txt";
            if (openDialog.ShowDialog()==true)
            {
                this.FileNameBox.Text = openDialog.FileName;
            }
        }
    }
}
When you have completed writing the sample code, press F5. This will start the application for debugging. At this point, a number of debugging and performance-analysis tools for WPF automatically appear (see Figure 3).
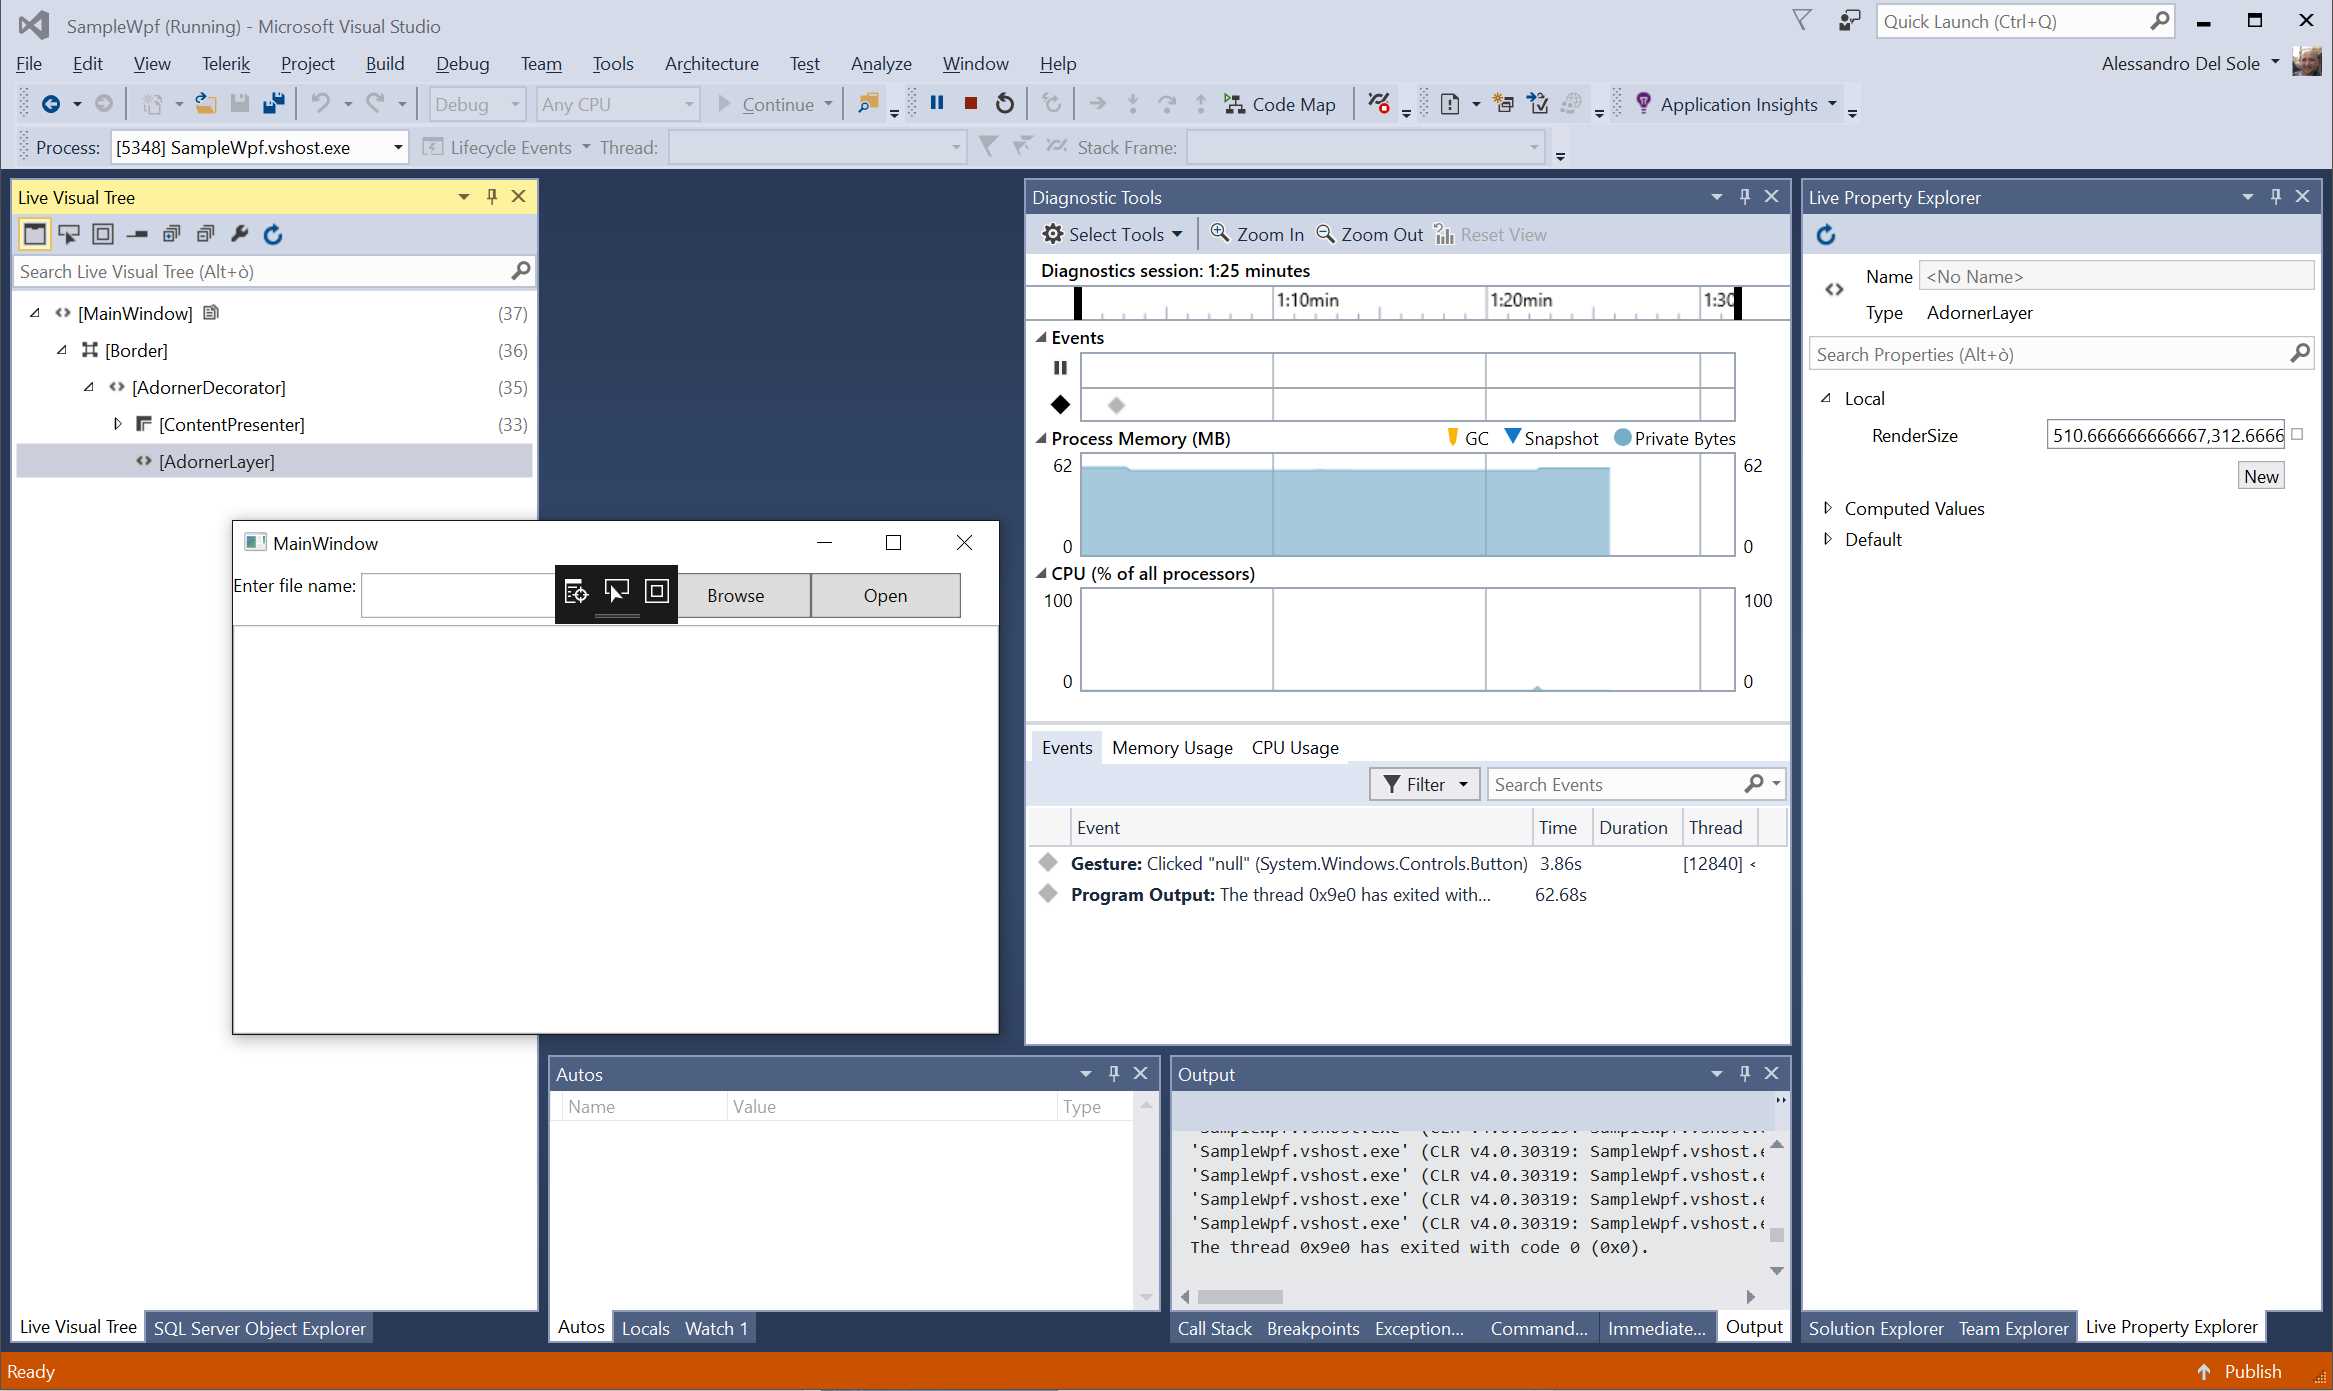
Figure 3: Debugging and Performance Tools
The black rectangle with three small buttons that overlays the main window of the application was first introduced in Visual Studio 2015 Update 2, and it allows for quick investigation into the user interface’s behavior at runtime (this will be discussed further in Chapter 5). This rectangle can be minimized when not needed. The Visual Studio IDE shows a number of tool windows:
These tool windows will be discussed thoroughly in Chapter 3 Working with Debug Windows (except for Live Visual Tree and Live Property Explorer, which will be discussed in Chapter 5 XAML Debugging). Of course, there are other useful tool windows and commands you can invoke from the Debug menu. Starting in the next chapter, we will start debugging the sample application in order to gain a deeper knowledge about the power of both the debugger and the Visual Studio IDE.
Debugging WPF applications involves the debugger that ships with Visual Studio and many integrated tools, such as commands and tool windows. Visual Studio 2015 Update 2 has also introduced new tools that make it easier to investigate the behavior of the user interface at runtime. You must be careful about enabling the Debug configuration, which allows the IDE to generate the proper symbols and makes the debugger capable of collecting all the necessary information about your code.