.NET Excel Library - Excel Pivot Tables in C#
- Create, read, and edit pivot tables.
- Apply 84 built-in pivot table styles.
- Customize the pivot table with multiple pivot options.
No credit card required.
VIEW DEMONo credit card required.
Trusted by the world’s leading companies

Overview
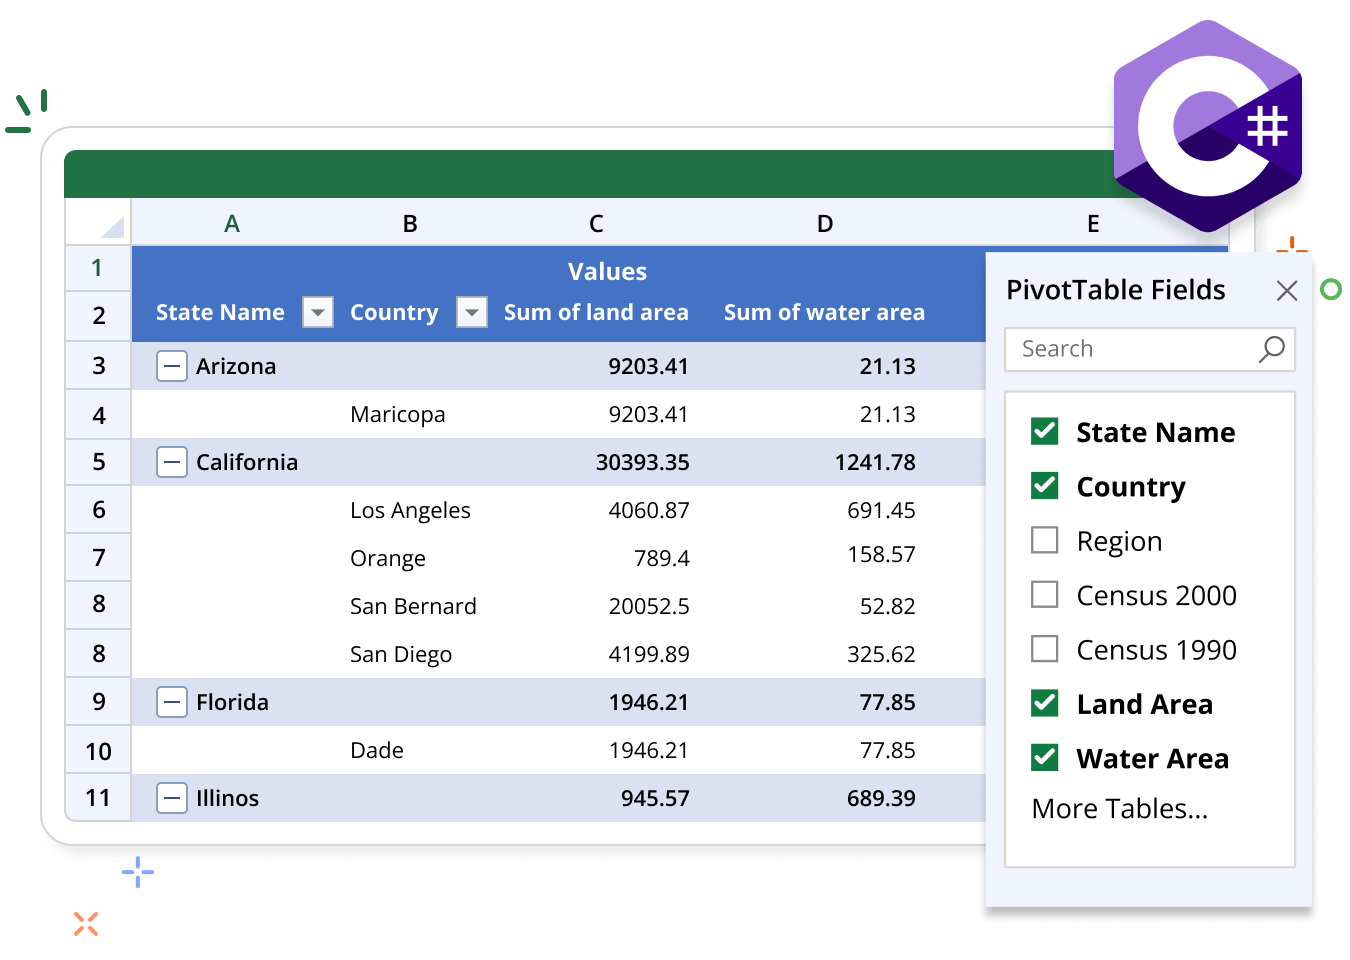
The Syncfusion .NET Excel library supports the creation and manipulation of pivot tables. Use pivot tables to organize, summarize, or calculate data dynamically. These functionalities can be achieved using just a few lines of code.
Pivot table code example
This example code shows how to create a pivot table in Excel using the Syncfusion .NET Excel Library with just a few lines of code in C#.
Key features of pivot tables
Discover how pivot table features in the Syncfusion Excel Library allow you to summarize, analyze, and organize data dynamically, enabling powerful data insights and streamlined reporting in Excel.
Styles and Formatting
Enhance your pivot table with various built-in styles to improve visual appeal and interpretation of data. You can also format individual cells to emphasize key metrics by adjusting font styles, colors, borders, and number formats, ensuring clarity and readability in your presentations.
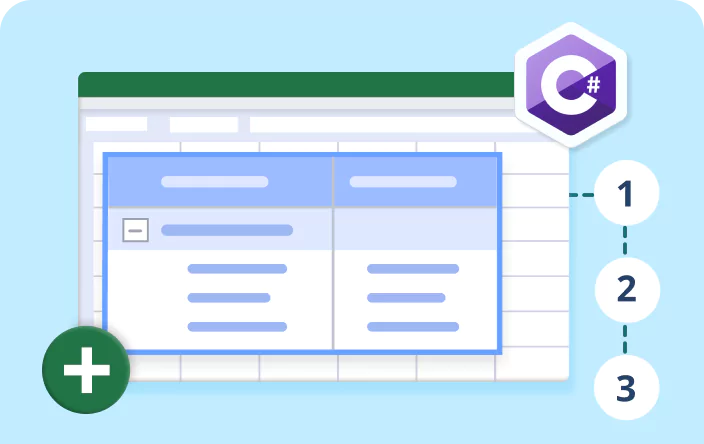
Layout
Customize the layout of your pivot table to enhance readability and organization. You can choose from several layout types, including compact, tabular, outline, and classic layouts, to suit your analysis needs. Rearrange fields and adjust the display of data to optimize the presentation of your information.
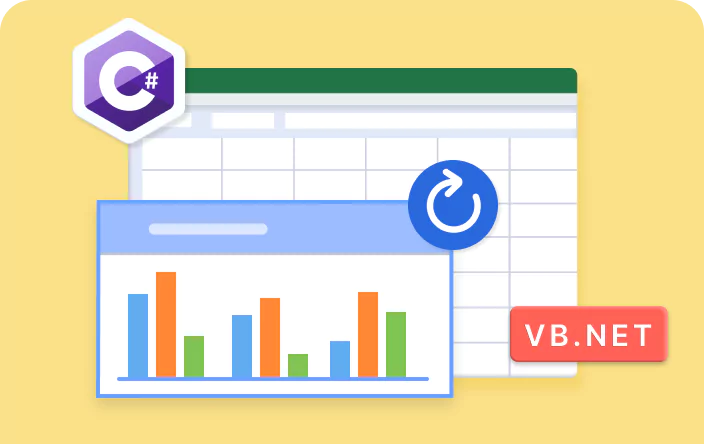
Refresh
Easily refresh your pivot table to update the data it displays. This ensures that any changes made to the source data are reflected in your pivot table, allowing for accurate and current insights.
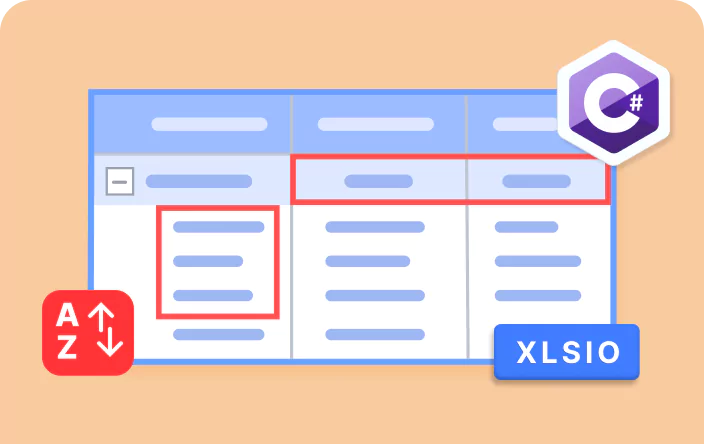
Sorting and Filtering
Utilize sorting and filtering features within your Pivot Table to organize data effectively. You can sort information to highlight key metrics and apply filters to focus on specific data points, making analysis more manageable.
Group by Time Range
Group data in your pivot table to aggregate information meaningfully. This allows you to organize data by time periods, facilitating deeper analysis and clearer presentation of results.
Expand and Collapse
You can expand or collapse data in your pivot table to focus on specific details or to get an overview of the information. This feature enhances your data exploration by allowing you to navigate through different levels of data granularity easily.
Pivot table references
Discover valuable resources from our blog and knowledge base to enhance your efficiency in using pivot tables.


Knowledge base
How to set custom formatting in the data fields of a pivot table in C#VB.NET
Knowledge base
How to create a pivot table in an Excel workbook with data exported using template markers in C#
Explore these resources for comprehensive guides, knowledge base articles, insightful blogs, and ebooks.


Product Updates

Technical Support


Frequently Asked Questions
Can I edit and format a pivot table using the Syncfusion Excel Library?
Yes, the Syncfusion Excel Library allows you to edit and format pivot tables. You can customize pivot table formatting and pivot cell formatting to enhance the appearance of your pivot tables.
Can I expand or collapse rows in a pivot table using the Syncfusion Excel Library?
Yes. Syncfusion Excel library allows you to expand or collapse rows in your pivot table effortlessly. This feature enables you to control the level of detail displayed, facilitating focused analysis on specific data points within your pivot table.
Can I apply sorting to a pivot table using the Syncfusion Excel Library?
Yes, you can apply sorting to pivot tables using the Syncfusion Excel Library. The library enables you to sort pivot table fields both top to bottom and left to right.
Is it possible to apply a pivot table layout using the Syncfusion Excel Library?
Yes. The Syncfusion Excel Library allows you to apply various layout options for pivot tables. You can choose a compact layout, outline layout, or tabular layout.
Can I apply pivot table filters using the Syncfusion Excel Library?
Yes, you can apply pivot table filters using the Syncfusion Excel Library. The library supports two types of filters: page filters and row/column filters. You can easily apply these filters to manipulate the data displayed within the pivot table.
Can I group date and time fields in a pivot table using the Syncfusion Excel Library?
Yes, you can group date and time fields in a pivot table using the Syncfusion Excel Library. It supports grouping pivot data based on various categories including date, month, year, quarters, hours, minutes, and seconds. This feature empowers you to organize and analyze your data efficiently based on different time-related intervals.
Our Customers Love Us


See Real Success Stories
Developers around the world trust Syncfusion’s Essential Studio to simplify complex projects and speed up delivery. With a vast library of UI controls, powerful SDKs, and reliable support, Essential Studio helps teams build enterprise-ready applications with confidence.
Explore Case StudiesIndustry
Software development
75% Cost reduction
50% Faster development
Industry
Utilities (oil and gas)
450+ hours saved
Streamlined processes and hours of development effort saved.
Advanced, flexible features
Empowered users through robust and versatile functionality.
Industry
Software and technology
1000+ of hours saved
Accelerated development with enterprise-ready UI components.
Efficient file management
Streamlined workflows with document libraries without building them from scratch.
Industry
Software and technology
2 Years of delay avoided
Two years of delays prevented with proactive planning.
On-time delivery
Projects delivered on schedule using trusted controls.
Industry
IT services and IT consulting
Improved performance
Large datasets handled with easy customization and quick debugging.
Highly customizable
Plug-and-play controls with quick template integration.
Industry
Professional services
Instant access
Quick availability of features and resources.
Reduced dependencies
Fewer dependencies for faster development.
Rated by users across the globe
Want to create, View, and edit Excel files in C# or VB.NET?
No credit card required.

Awards
Greatness—it’s one thing to say you have it, but it means more when others recognize it. Syncfusion® is proud to hold the following industry awards.

