
The .NET MAUI TreeMap control visually represents hierarchical data using nested rectangles, sized and colored based on underlying values. It efficiently displays grouped and nested data structures, offering extensive customization options and supporting item selection.
Easily get started with the .NET MAUI TreeMap using a few simple lines of XAML code example as demonstrated below. Also, explore our .NET MAUI TreeMap Example that shows you how to render and configure the .NET MAUI TreeMap.
- <?xml version = "1.0" encoding = "UTF-8" ?>
- <Application xmlns="http://schemas.microsoft.com/dotnet/2021/maui"
- xmlns:x="http://schemas.microsoft.com/winfx/2009/xaml"
- xmlns:local="clr-namespace:SampleBrowser.Maui.TreeMap"
- xmlns:base="clr-namespace:SampleBrowser.Maui.Base;assembly=SampleBrowser.Maui.Base"
- xmlns:syncTheme="clr-namespace:Syncfusion.Maui.Themes;assembly=Syncfusion.Maui.Core"
- x:Class="SampleBrowser.Maui.TreeMap.App">
- <Application.Resources>
- <ResourceDictionary>
- <ResourceDictionary.MergedDictionaries>
- <syncTheme:SyncfusionThemeResourceDictionary />
- <base:SampleBrowserStyles/>
- </ResourceDictionary.MergedDictionaries>
- </ResourceDictionary>
- </Application.Resources>
- </Application>
The .NET MAUI TreeMap organizes data into groups with leaf items represented as rectangles, providing clear data representation.
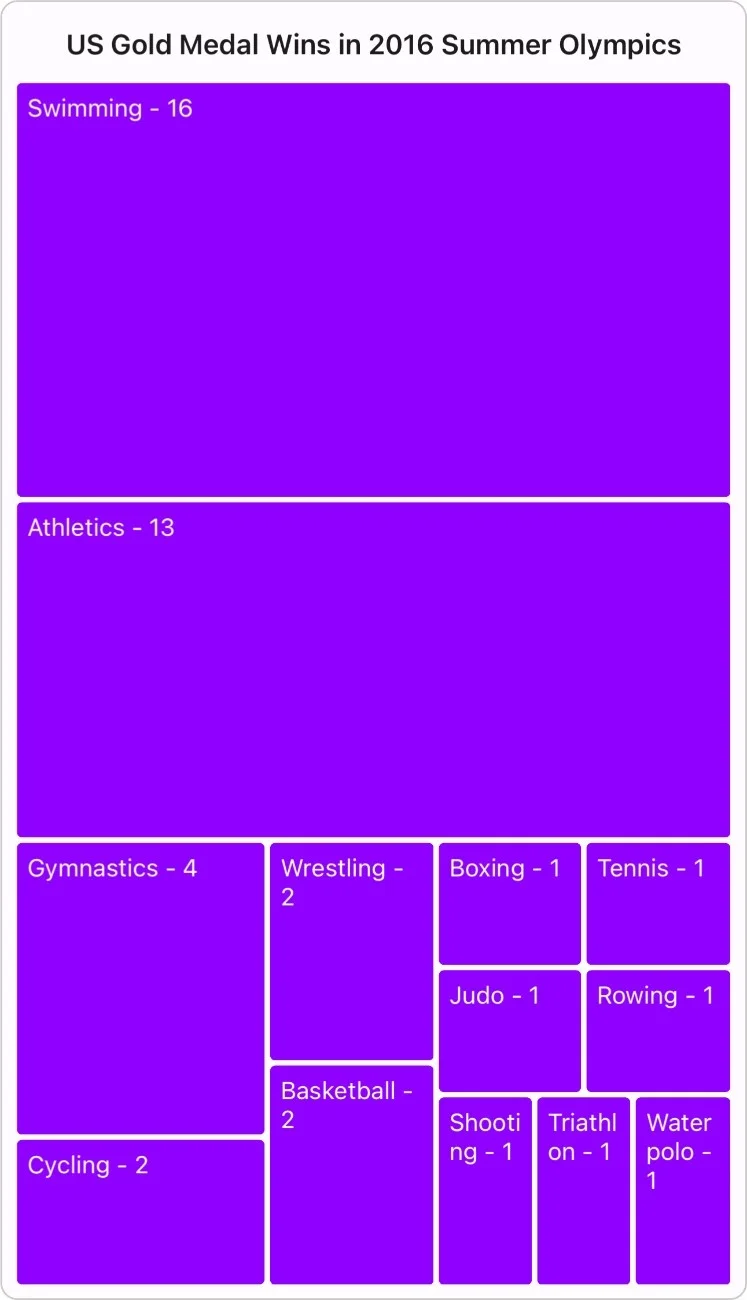
Use different layout types for effective visualization of structured data.
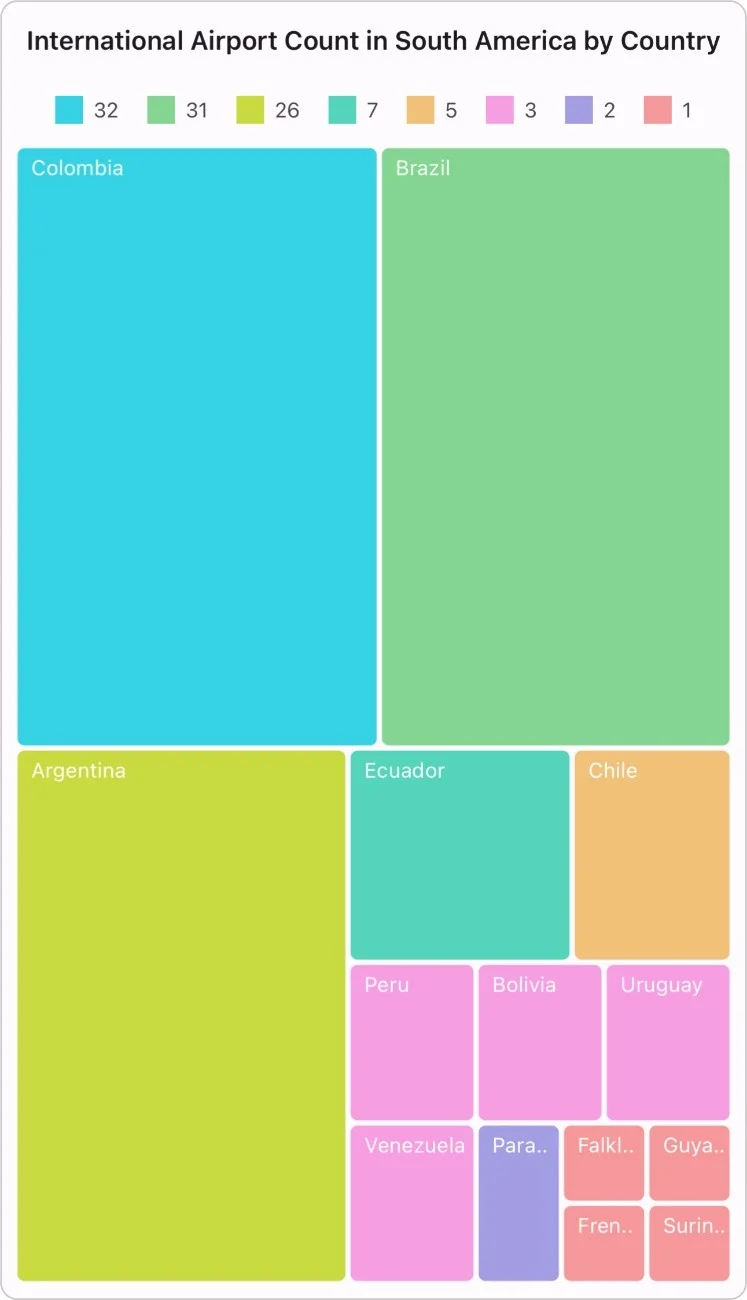
Visualize data in square-like rectangles with optimal aspect ratio.
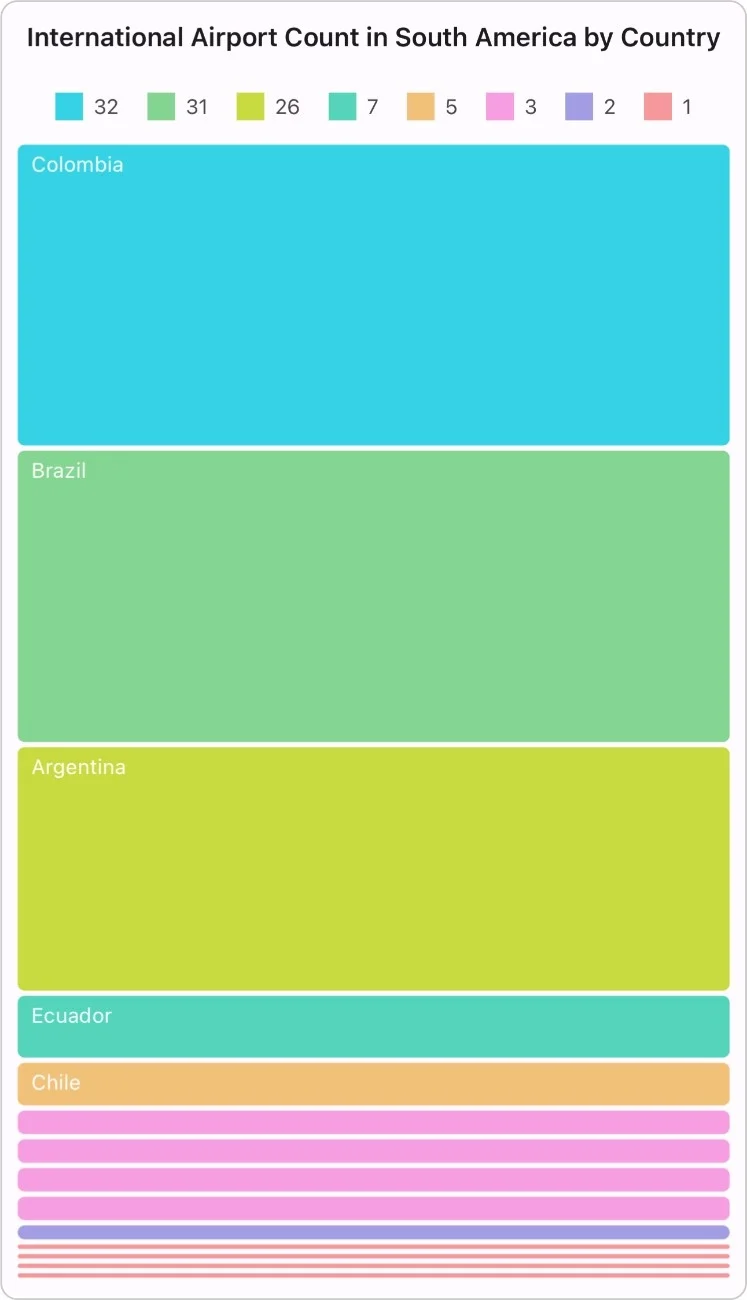
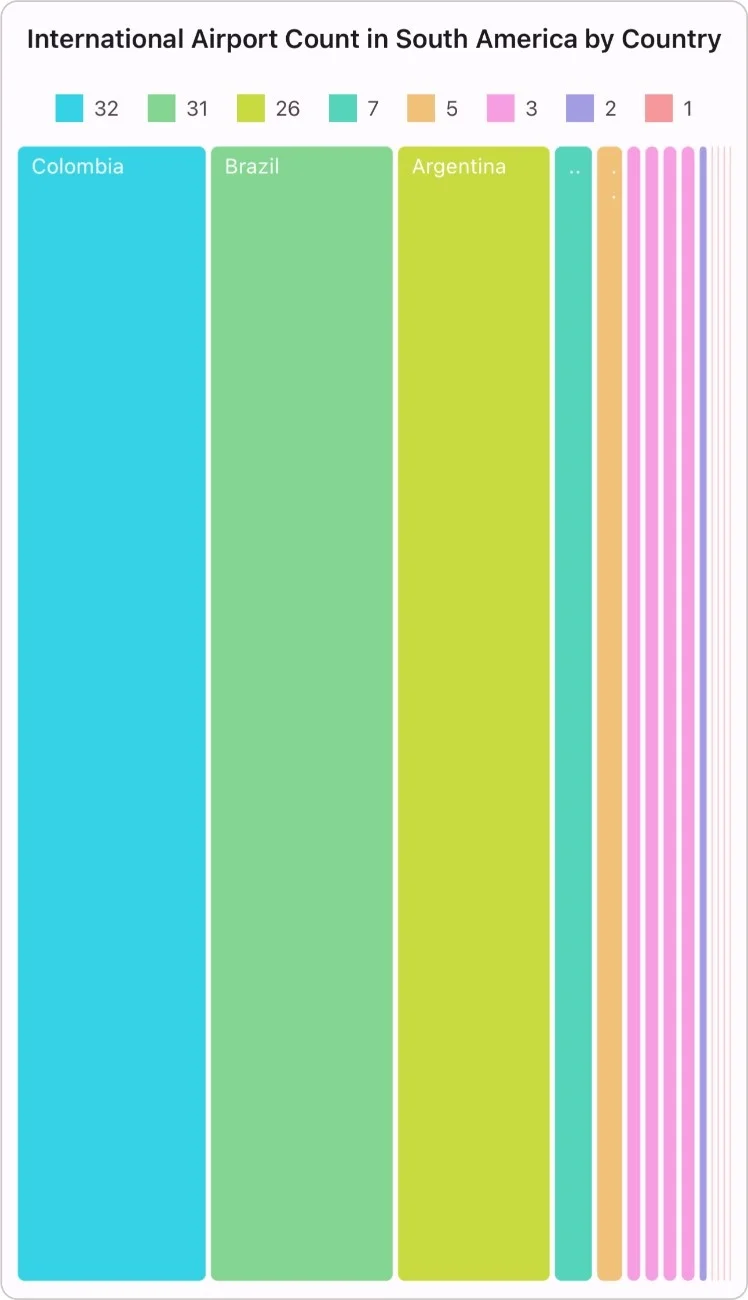
Visualize long, thin rectangles vertically or horizontally with a high aspect ratio.
Create horizontal rectangles with a high aspect ratio.
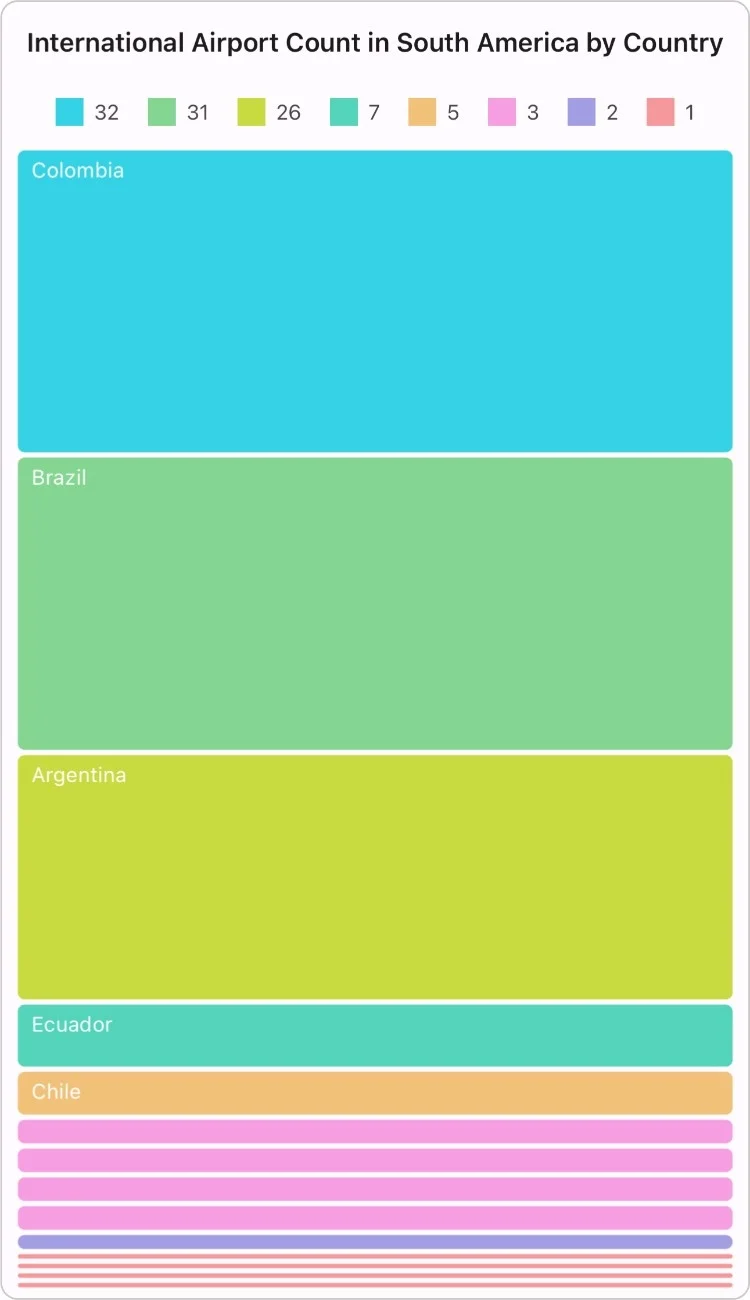
Create vertical rectangles with a high aspect ratio.
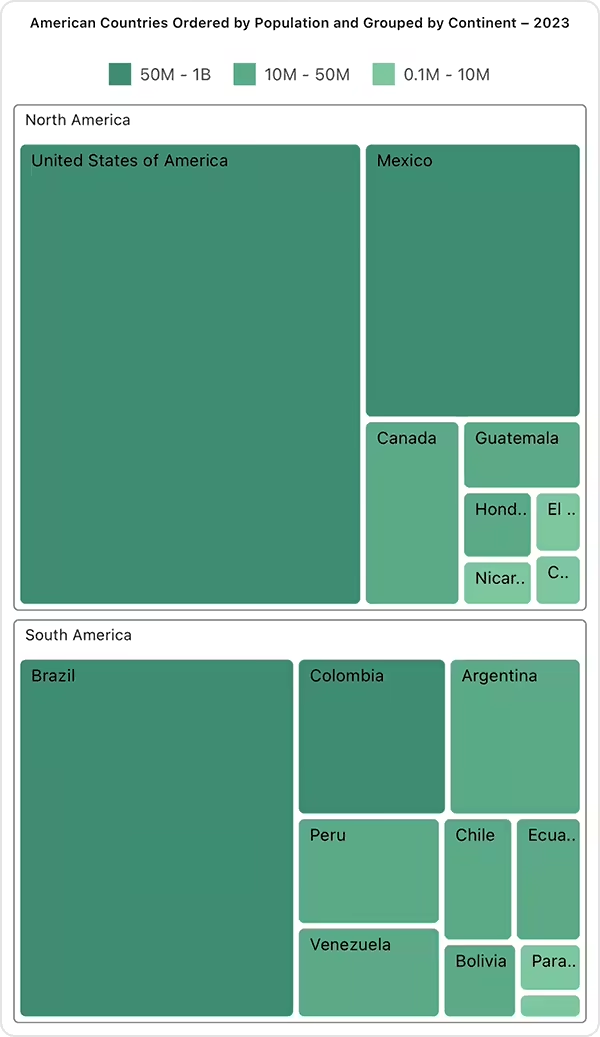
The .NET MAUI TreeMap control seamlessly integrates multiple hierarchical data levels for richer and more detailed visualizations.
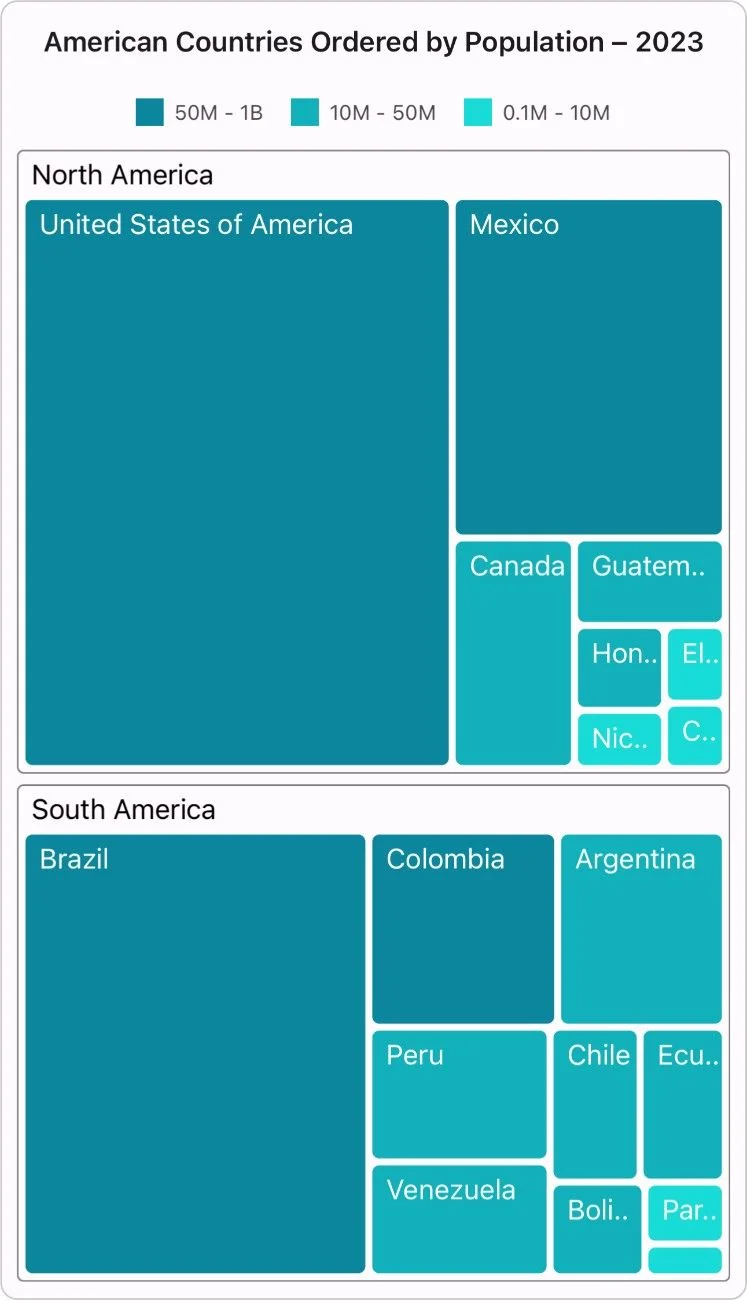
Customize the tree map leaf item colors based on underlying values for enhanced visual clarity, aiding data interpretation.
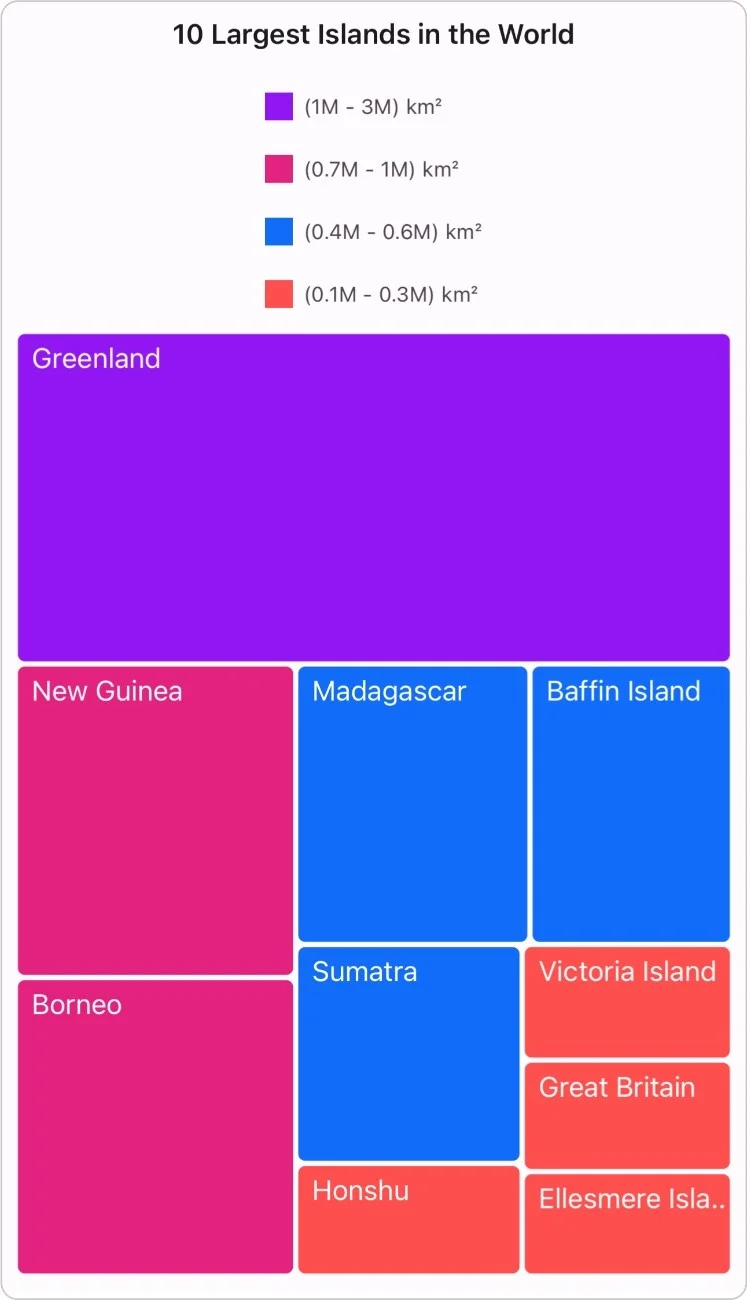
Apply colors to the tree map leaf items based on a desired numeric range.
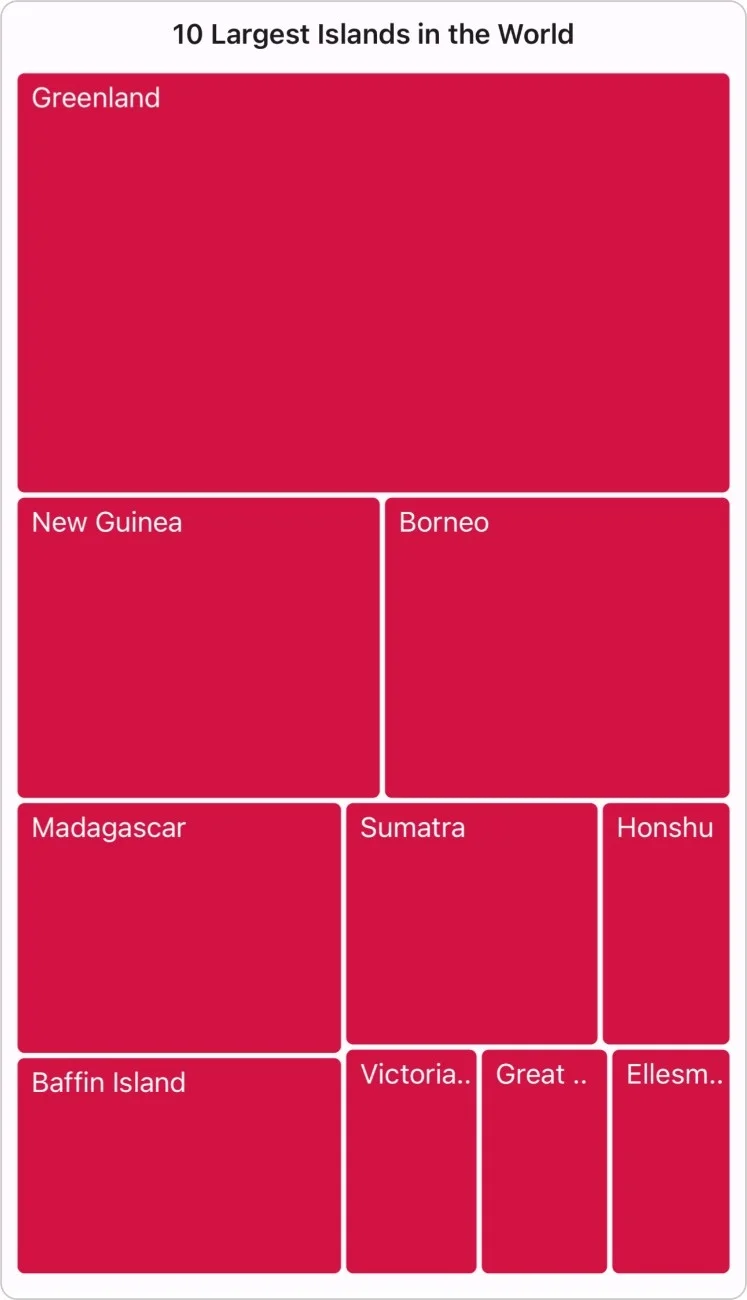
Apply a single color to all tree map leaf items.
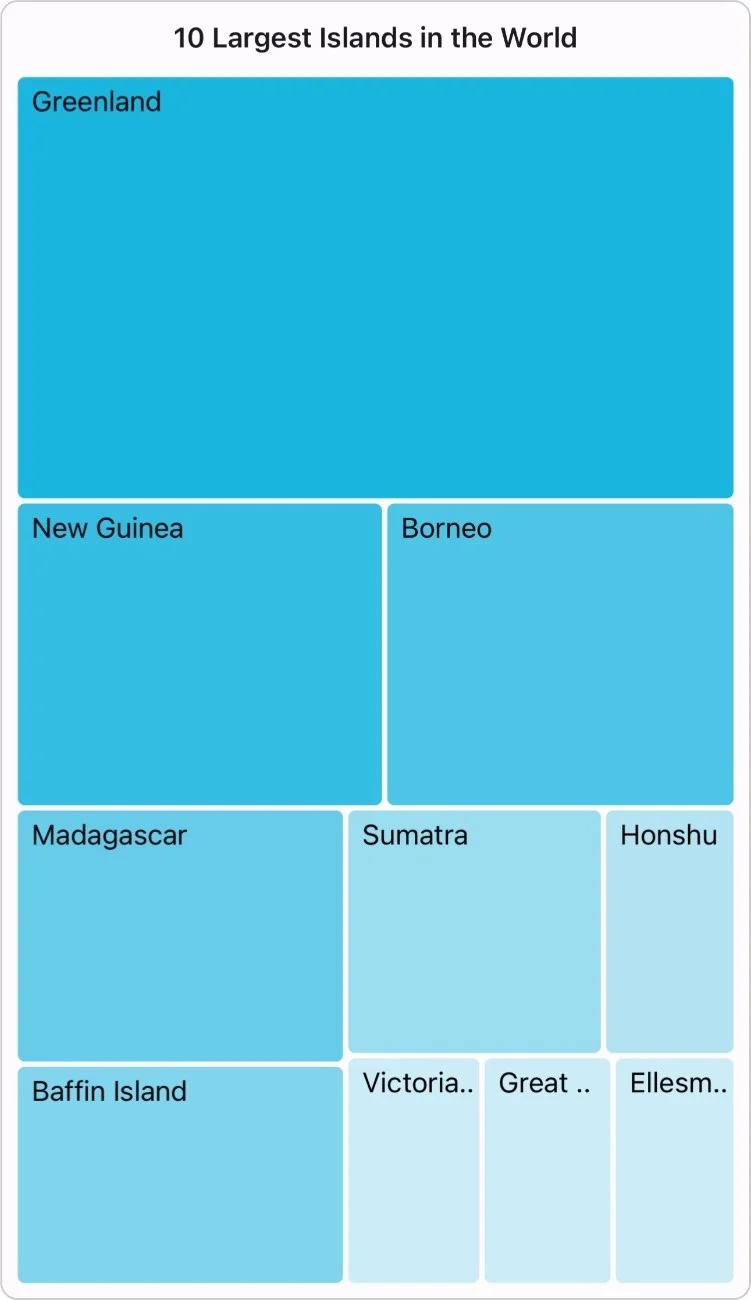
Apply colors to tree map leaf items by comparing their values with the desaturation color order.
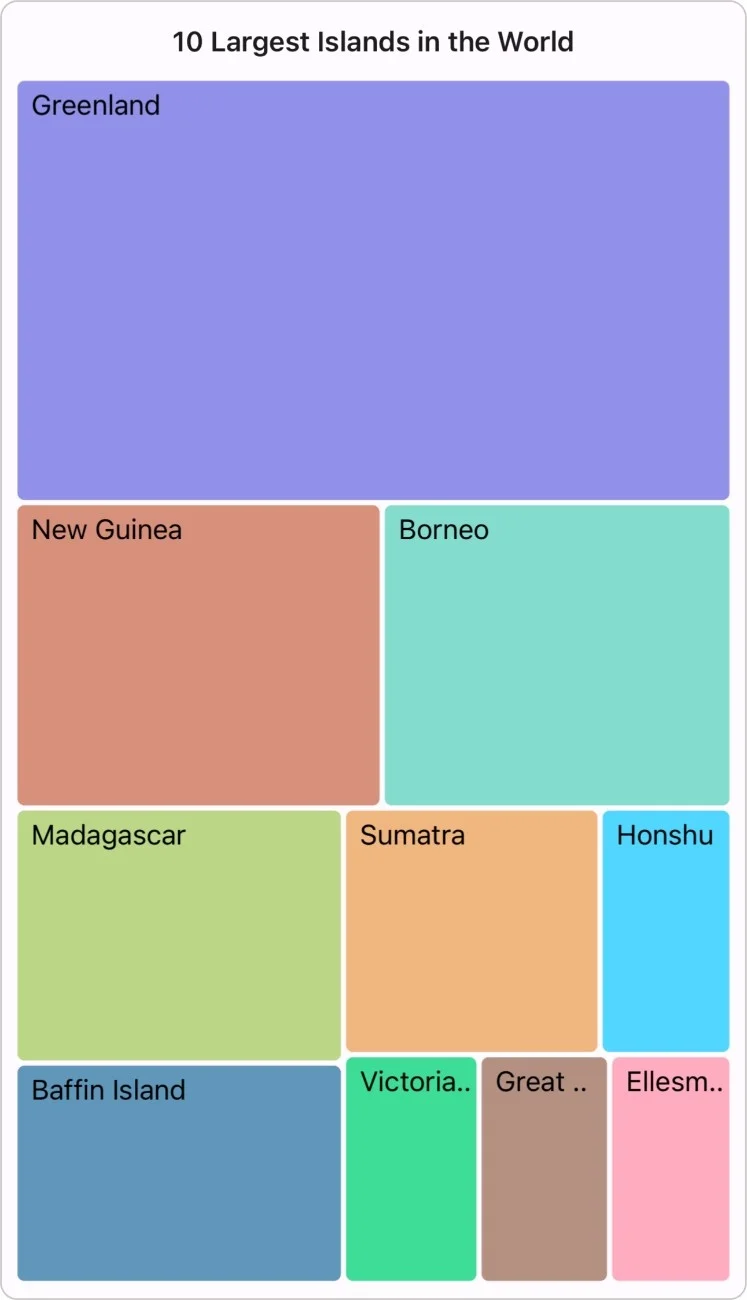
Each tree map leaf item adopts colors from the specified palette brush settings.
Use legends to add additional information for interpreting a TreeMap with various colors, shapes, and more.
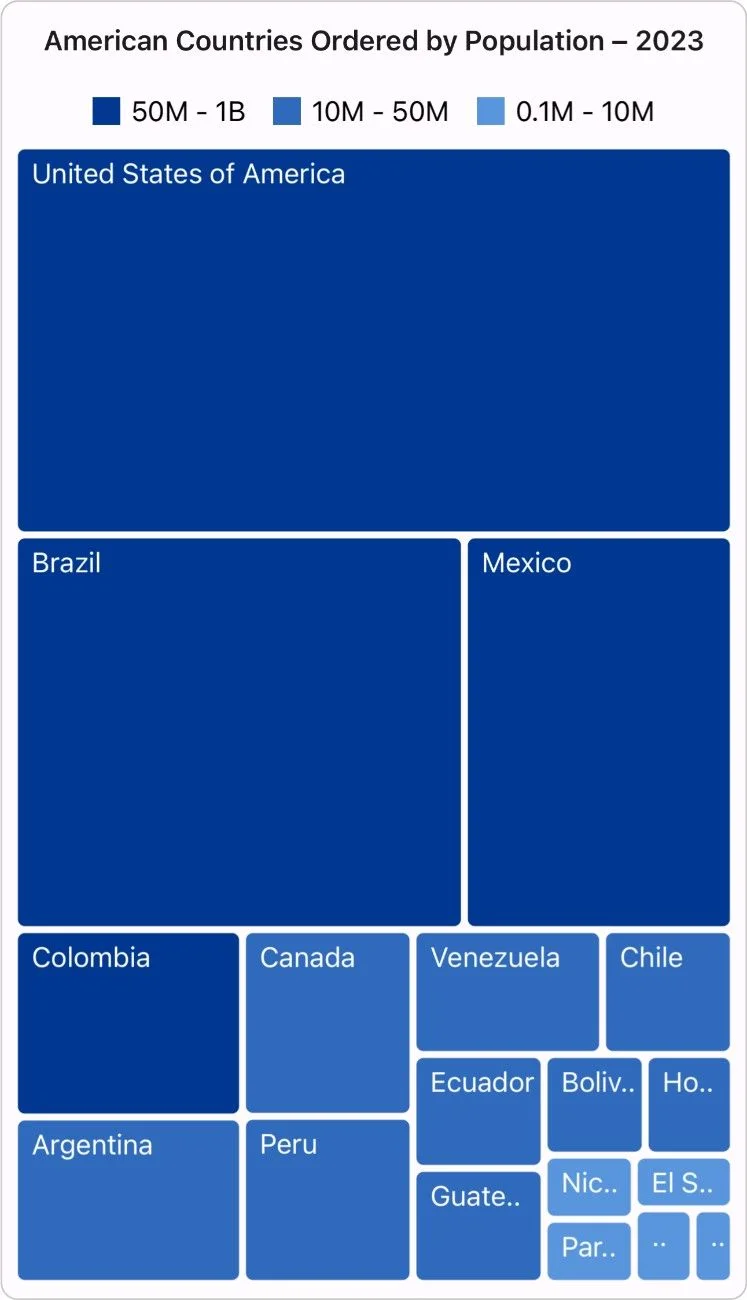
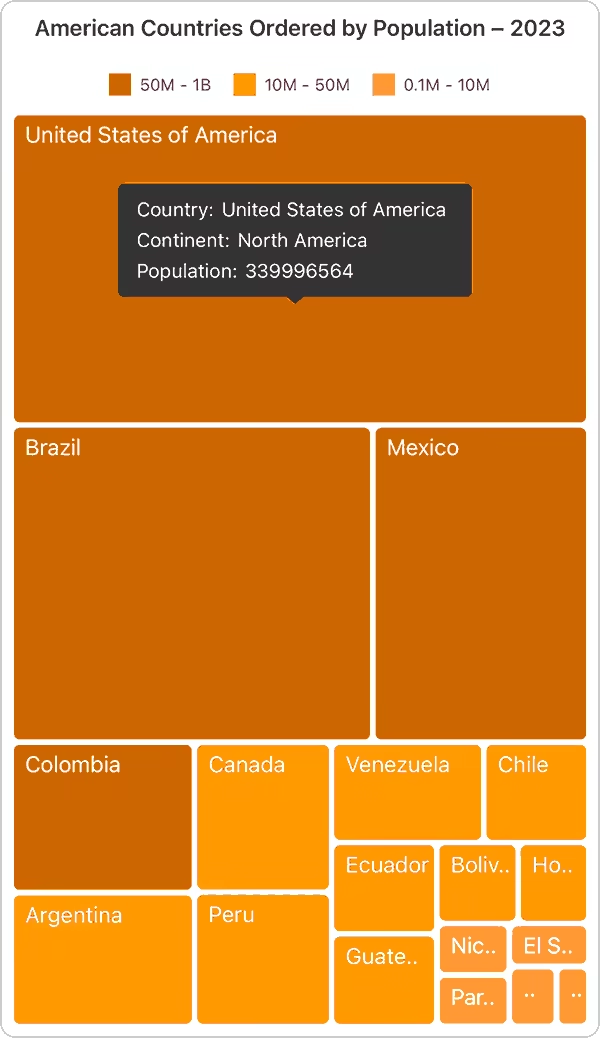
When the mouse hovers over items, the interactive TreeMap displays details about items’ values in tooltips.
Select a single item or multiple items through interaction and programmatically.
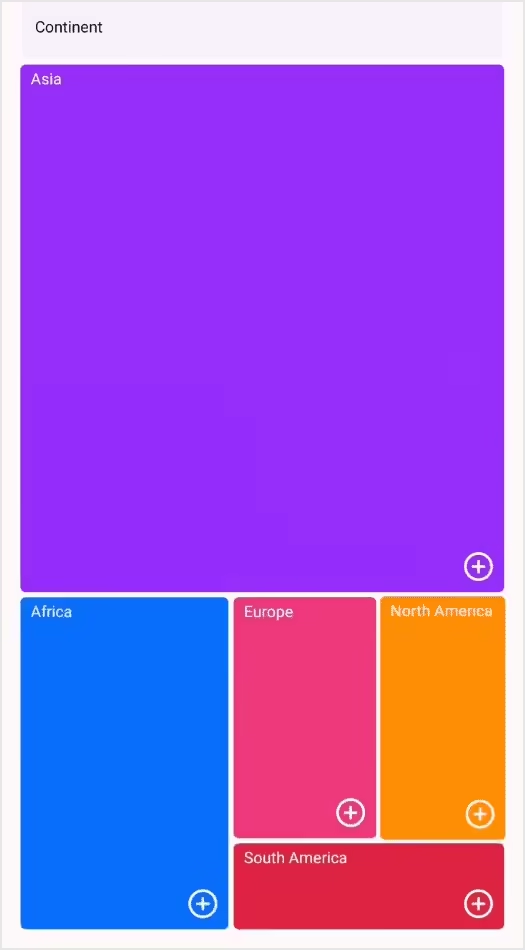
The drill-down feature allows users to explore hierarchical data interactively by navigating through its levels.
Users can customize the stroke color, stroke width, background color, selection color, tree map data template, and more.
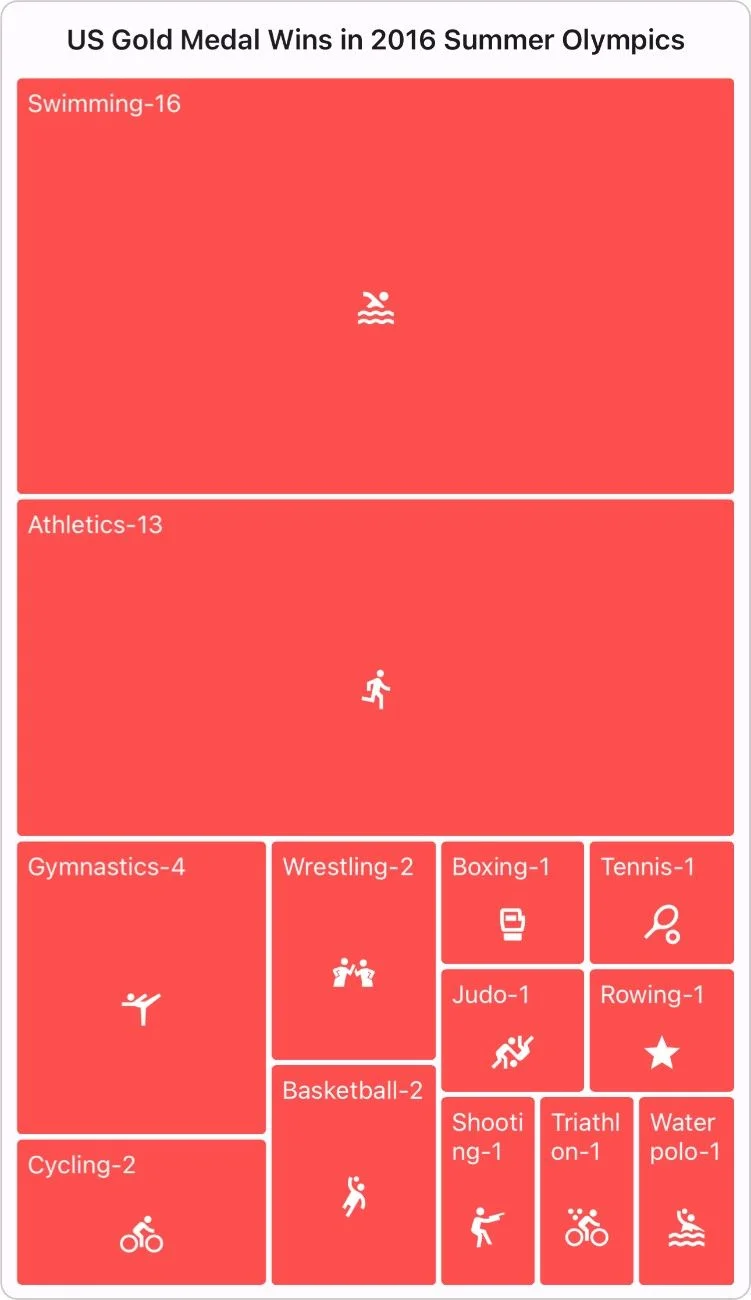
The Syncfusion .NET MAUI TreeMap control supports the following features:
You can find our .NET MAUI TreeMap demo, which demonstrates how to render and configure the TreeMap.
The .NET MAUI TreeMap control visually represents hierarchical data using rectangles that are sized and colored based on the underlying values.
You can customize the .NET MAUI TreeMap’s appearance by adjusting colors, using different brush settings, and defining data templates for item presentation.
Yes, the .NET MAUI TreeMap supports multiple hierarchical levels, allowing you to visualize and explore nested data structures in a clear and organized manner.
No, this is a commercial product and requires a paid license. However, a free community license is also available for companies and individuals whose organizations have less than $1 million USD in annual gross revenue, 5 or fewer developers, and 10 or fewer total employees.
A good place to start would be our comprehensive getting started documentation.
The .NET MAUI TreeMap control offers multiple layout types, including squarified, slice and dice horizontal, slice and dice vertical, and slice and dice auto.
Yes, the .NET MAUI TreeMap supports tooltips to display additional information when you hover over data points.
Yes, the .NET MAUI TreeMap supports drill-down functionality, allowing users to interact with items and explore hierarchical data in more detail by navigating to deeper levels within the TreeMap.
 Figma Download
Greatness—it’s one thing to say you have it, but it means more when others recognize it. Syncfusion® is proud to hold the following industry awards.