Trusted by the world’s leading companies

Overview
The Flutter Linear Gauge is a data visualization widget that can be used to display data on a linear scale either horizontally or vertically. It has highly customizable elements, including its axis, ranges, and pointers. With this Linear Gauge, it is very easy to simulate widgets like thermometers, rulers, progress bars, and water trackers.
Orientation
The appearance of the Linear Gauge can be set to both vertical and horizontal orientations.
Axis track
The axis is a scale where a set of values can be plotted. An axis can be customized by changing its thickness, color, and edge styles. You can also invert the axis.
Ticks and labels
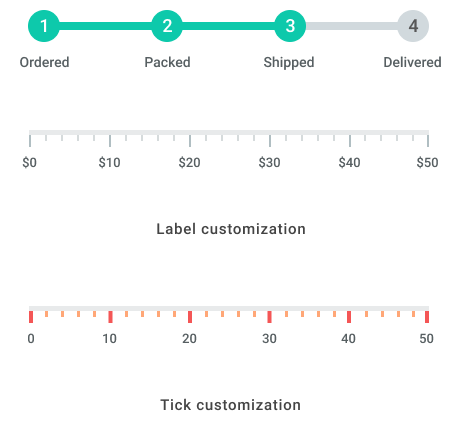
The axis elements, such as labels, major ticks, and minor ticks, can be customized to different styles.
Range
A range is a visual element that helps you quickly see where a data range falls on the axis track. Multiple ranges with different styles can be added to a linear gauge.
Pointers
A pointer is used to indicate a specific value on an axis. The widget has three types of pointers: shape marker pointer, widget marker pointer, and bar pointer. All the pointers can be customized as needed. You can add multiple pointers in a linear gauge.
Pointer interaction
The shape and widget marker pointers can be moved from one value to another with swipe or drag gestures.

Pointer drag behavior
Controls the pointer drag when there are multiple pointers in a Linear Gauge. The available drag behaviors are free and constrained.

Animation
Animate the gauge elements in a visually appealing way when they are loading, or when their values change.

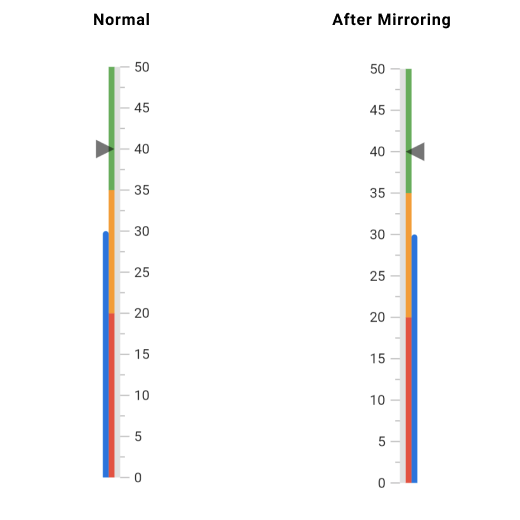
Mirror Linear Gauge
When the mirror option is enabled, all the elements added to the gauge will be immediately mirrored.

Real-time examples
With the Flutter Linear Gauge widget, you can easily simulate thermometers, rulers, progress bars, water trackers, and more.
Thermometer

Water tracker
![]()
Height calculator

All our Flutter UI & DataViz Widgets
Our Customers Love Us


Awards
Greatness—it’s one thing to say you have it, but it means more when others recognize it. Syncfusion® is proud to hold the following industry awards.


