- Home
- Forum
- Xamarin.Forms
- Axis even numbering
Axis even numbering
Hi,
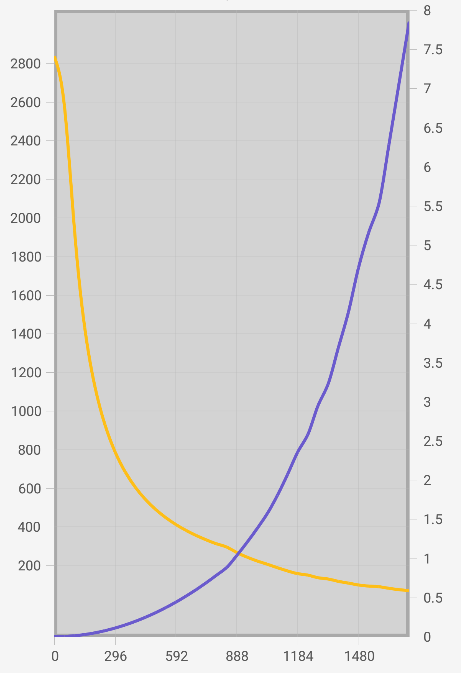
1). How do I achieve even axis numbering? I've plotted X, Y1 and Y2. What I'm getting is below and X axis labels are not evenly distributed. I would like evenly distribute the labels for X,Y1 and Y2 axis (depending on the calculations, Y1 and Y2 will have uneven labels in 3 decimal points).
My Plot:
This is the sample data set, with plot generated that I'm trying to achieve:
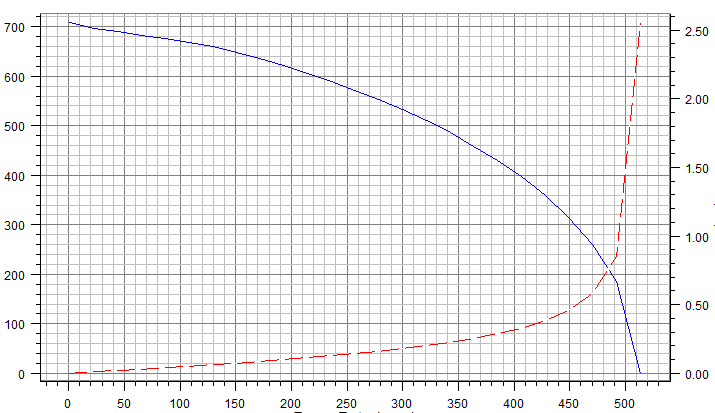
Data set:
| X Axis Common | Y1 Axis | Y2 Axis |
| 1 | 707.9 | 0 |
| 22.3 | 696.9 | 0.01 |
| 43.7 | 689.8 | 0.02 |
| 65 | 683 | 0.031 |
| 86.4 | 675.9 | 0.041 |
| 107.7 | 668 | 0.052 |
| 129 | 659 | 0.063 |
| 150.4 | 648.4 | 0.074 |
| 171.7 | 635.1 | 0.087 |
| 193.1 | 621.3 | 0.1 |
| 214.4 | 606.3 | 0.113 |
| 235.8 | 590.1 | 0.128 |
| 257.1 | 571.9 | 0.144 |
| 278.4 | 552.9 | 0.162 |
| 299.8 | 532.3 | 0.181 |
| 321.1 | 510.2 | 0.202 |
| 342.5 | 485.5 | 0.226 |
| 363.8 | 458.8 | 0.254 |
| 385.1 | 430.6 | 0.287 |
| 406.5 | 398.2 | 0.327 |
| 427.8 | 359.6 | 0.382 |
| 449.2 | 314.8 | 0.458 |
| 470.5 | 260.3 | 0.58 |
| 491.9 | 185.3 | 0.852 |
| 513.2 | 0.3 | 2.555 |
2) How do I plot a single data point on the my current chart, based on the X and Y1 axis range, to show the user where his results are eg.
Point(X,Y1) = 410,358 (Y2 ignored).
I've tried adding new line series and binding to one data point only, but new axis are created with the min/max range that doesn't align my data set.
thanks,
Mike
SIGN IN To post a reply.
3 Replies
RA
Rachel A
Syncfusion Team
July 3, 2019 12:39 PM UTC
Hi Michal,
Thanks for contacting Syncfusion Support.
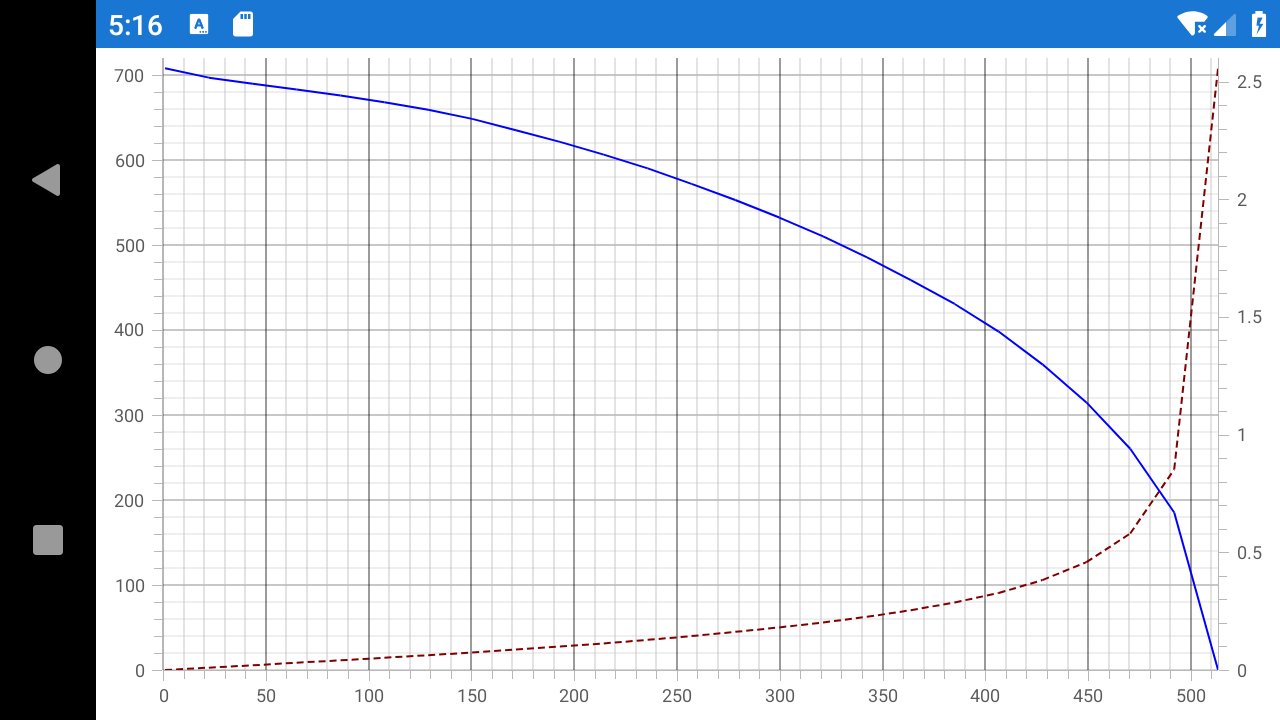
Query 1: How do I achieve even axis numbering?
You can achieve this requirement by using the Interval property which is available in ChartAxis. You can refer the below documentation link to know more information about axis.
Output:
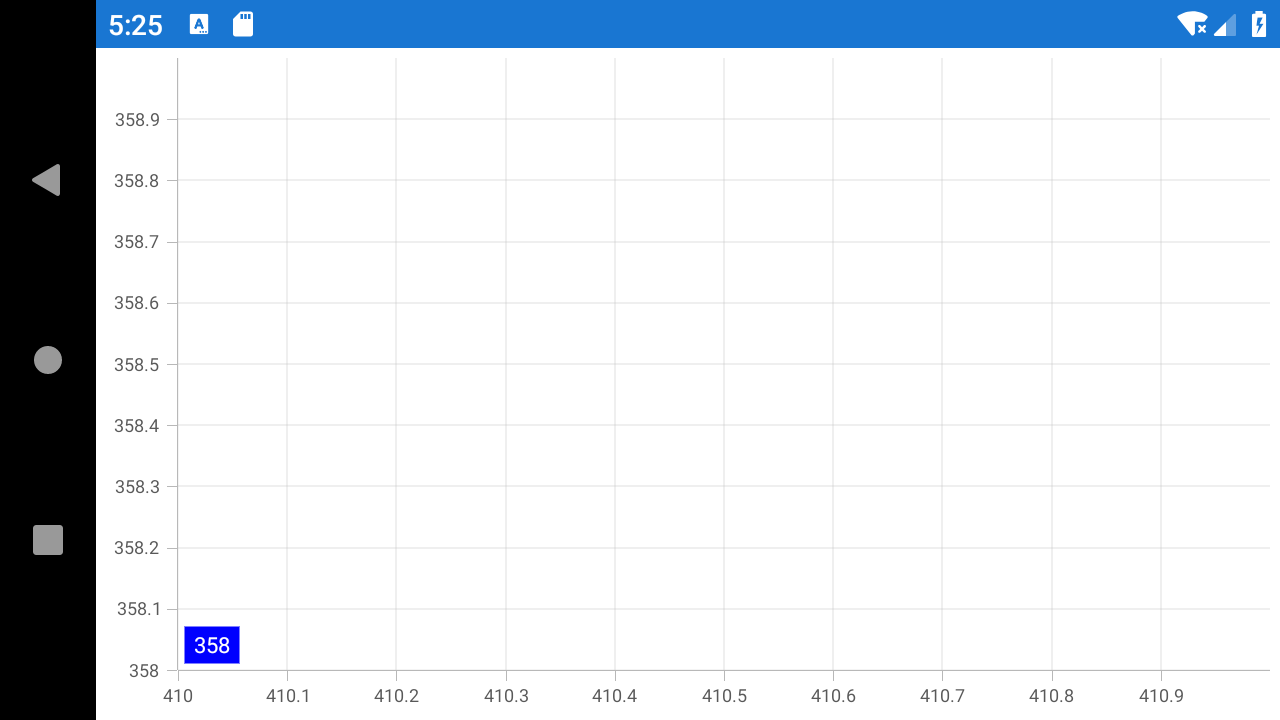
Query 2: How do I plot a single data point on my current chart?
The line cannot be drawn if we give only one data point. If your requirement is to show the details of the data point, you can use the data marker labels.
Output:
You can download the sample for reference from the below link.
If the above explained scenario is not your requirement, please revert us with detailed information your requirement which will be helpful for us to investigate further.
Regards,
Rachel.
MI
Michal
July 6, 2019 12:46 PM UTC
Got it working.
Thank you
RA
Rachel A
Syncfusion Team
July 8, 2019 05:20 AM UTC
Hi Michal,
We are glad that the reported problem resolved at your end. Please let us know, if you have any other queries.
Thanks,
Rachel.
SIGN IN To post a reply.
- 3 Replies
- 2 Participants
-
MI Michal
- Jul 3, 2019 09:53 AM UTC
- Jul 8, 2019 05:20 AM UTC
