Syncfusion’s .NET MAUI Charts controls continue to evolve, and the 2023 Volume 3 release brings exciting new features that enhance data visualization and user interaction. Let’s explore those new features with code examples.
Zooming selection
Zooming selection is a valuable feature that empowers users to dive deeper into their data. This feature allows users to select a rectangular section on a chart and zoom in for a more detailed view. It provides a dynamic and interactive way to explore specific data points and patterns within the chart, improving the overall user experience.
Refer to the following code example.
<chart:SfCartesianChart>
 . . .
 . . .
 <chart:SfCartesianChart.ZoomPanBehavior>
  <chart:ChartZoomPanBehavior EnableSelectionZooming="True"/>
 </chart:SfCartesianChart.ZoomPanBehavior>
 . . .
</chart:SfCartesianChart>
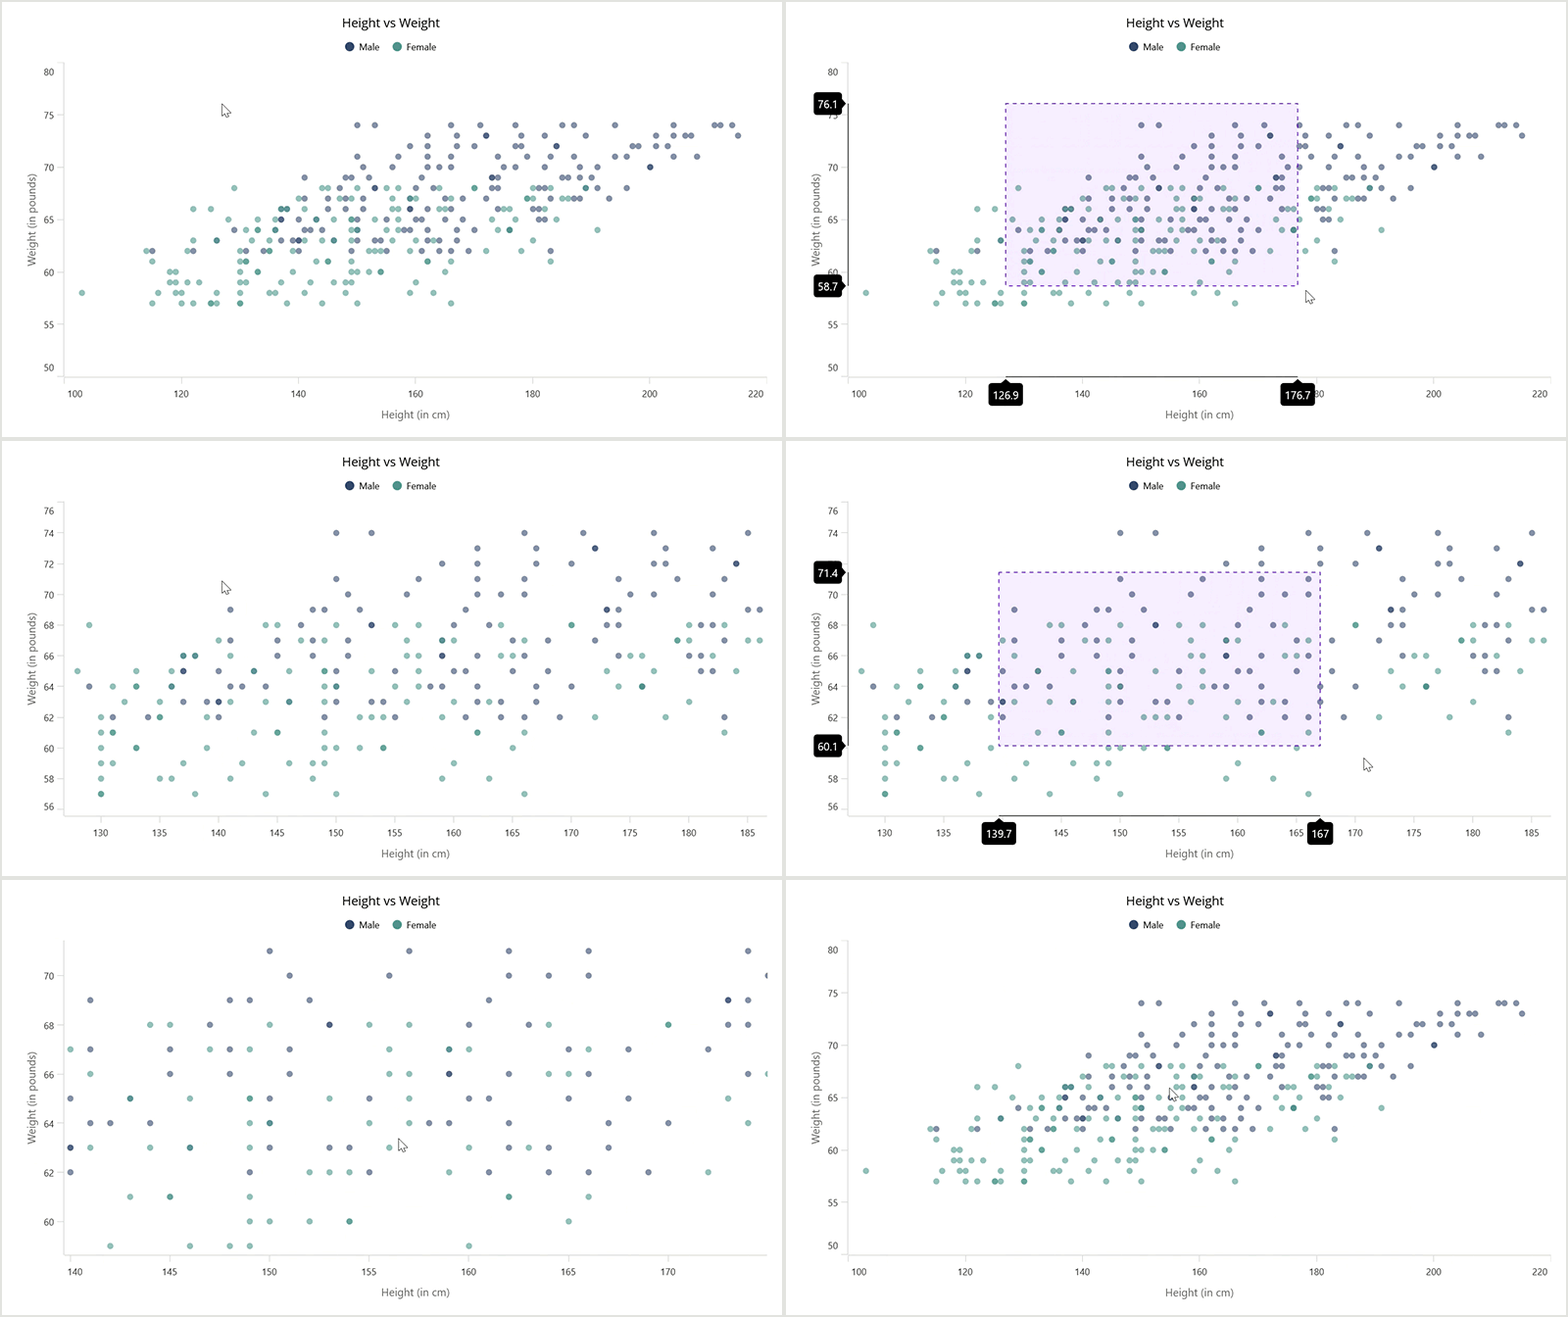
Directional zoom
Directional zoom adds another layer of flexibility to the charting experience. Users can now zoom in on either the horizontal or vertical axis independently. This capability lets users focus on specific dimensions of the data, making it easier to analyze trends and variations along a particular axis. Whether studying time-based data or examining values along a specific range, directional zoom enhances data exploration. Refer to the following code example.
<chart:SfCartesianChart>
 . . .
 . . .
 <chart:SfCartesianChart.ZoomPanBehavior>
  <chart:ChartZoomPanBehavior EnablePinchZooming="True" EnableDirectionalZooming="True"/>
 </chart:SfCartesianChart.ZoomPanBehavior>
 . . .
</chart:SfCartesianChart>
Display and hide tooltips programmatically
The ability to programmatically control tooltips enhances user interaction and customization. Users can now display or hide tooltips at specific chart locations through code. This feature offers greater control over the presentation of data and enables developers to create more interactive and informative charting experiences. Refer to the following code examples.
XML
<chart:SfCartesianChart>
 . . .
 . . .
 <chart:SfCartesianChart.TooltipBehavior>
  <chart:ChartTooltipBehavior x:Name="tooltipBehavior"/>
 </chart:SfCartesianChart.TooltipBehavior>
 . . .
</chart:SfCartesianChart>
C#
private void Button_Clicked(object sender, EventArgs e)
{
    //Display the tooltip on button click at the specified location (234f, 124f).
    tooltipBehavior.Show(234f, 124f, true);
}
Exposed chart interaction override methods
Chart interaction is crucial for a responsive and user-friendly experience. The 2023 Volume 3 release exposes the chart interaction override methods that enable developers to customize chart behavior based on user interactions.
By responding to touch interactions (OnTouchDown, OnTouchUp, and OnTouchMove), developers can obtain precise chart touch point coordinates and tailor chart responses to meet specific requirements. This level of customization enhances the chart’s usability and adaptability. Refer to the following code example.
public class BehaviorExt: ChartInteractiveBehavior
{
    //Detect when the mouse left is down over the chart.
    protected override void OnTouchDown(ChartBase chart, float pointX, float pointY)
    {
        base.OnTouchDown(chart, pointX, pointY);
    }

    //Detect when the mouse is moved over the chart.
    protected override void OnTouchMove(ChartBase chart, float pointX, float pointY)
    {
        base.OnTouchMove(chart, pointX, pointY);
    }

    //Detect when the mouse left is up over the chart.
    protected override void OnTouchUp(ChartBase chart, float pointX, float pointY)
    {
        base.OnTouchUp(chart, pointX, pointY);
    }
}
New value-to-point and point-to-value conversion methods
The new Value to Point and Point to Value conversion methods bring convenience and versatility to the .NET MAUI Cartesian Charts.
These methods allow developers to obtain chart coordinates based on provided screen points and vice versa. It simplifies translating between data values and chart positions, making it easier to work with data programmatically.
Refer to the following code examples.
protected override void OnTouchDown(ChartBase chart, float pointX, float pointY)
{
    base.OnTouchDown(chart, pointX, pointY);

    if (chart is SfCartesianChart cartesianChart)
    {
        //Convert screen point to chart point.
        var xValue = cartesianChart.PointToValue(cartesianChart.XAxes[0], pointX, pointY);
        var yValue = cartesianChart.PointToValue(cartesianChart.YAxes[0], pointX, pointY);

        //Convert chart point to screen point.
        var xPoint = cartesianChart.ValueToPoint(cartesianChart.XAxes[0], xValue);
        var yPoint = cartesianChart.ValueToPoint(cartesianChart.YAxes[0], yValue);

    }
}
Conclusion
Thanks for reading! In this blog, we’ve explored the new features added to the Syncfusion .NET MAUI Charts controls for the 2023 Volume 3 release. Use these features to enhance the readability of your chart data. Also, check out our Release Notes and What’s New pages to see the other updates of 2023 Volume 3.
The new version is available for existing customers from the License and Downloads page. If you are not a Syncfusion customer, try our 30-day free trial to check out our available features.
You can also contact us through our support forum, support portal, or feedback portal. We are always happy to assist you!
Related blogs
- Chart of the Week: Creating a .NET MAUI Horizontal Bar Chart to Compare Grocery Prices Between Two Countries
- Replicating a Storage UI in a .NET MAUI App
- Easily Build a ChatGPT-like App in .NET MAUI Using OpenAI APIs
- Load a Custom Badge UI in Your .NET MAUI App: An Overview
