TL;DR: Learn to seamlessly load data from various sources into the Syncfusion Blazor Charts component. This blog explores its ability to integrate with different data sources, including IEnumerable, remote data, JSON, observable collections, and SQL. We’ll focus on loading IEnumerable data in Blazor Charts, specifically using list binding.
Charts are a powerful tool for visualizing data in an interactive and user-friendly manner. They can seamlessly integrate with different data sources, whether stored in a local array, a remote server, or a cloud-based database.
The Syncfusion Blazor Charts component is designed to elegantly visualize a large volume of data. It offers a rich feature set with functionalities like data binding, multiple axes, legends, animations, data labels, annotations, trackballs, tooltips, technical indicators, zooming, and more.
In this blog, we’ll provide a step-by-step guide on integrating the Blazor Charts with various data sources. Additionally, we’ll discuss three crucial properties of Blazor Charts that are essential for configuring the data:
- DataSource: Collects the data points for the chart.
- XName: Retrieves the x-axis value from the DataSource.
- YName: Retrieves the y-axis value from the DataSource.
By the end of this tutorial, you’ll be creating dynamic and interactive charts that seamlessly update in real time whenever your data source changes.
Let’s get started!
Key data sources
Let’s explore the Syncfusion Blazor Charts, a versatile tool that supports various data sources for its components. The following are key data sources that it can seamlessly integrate with:
In the upcoming sections, we will explore these data sources in detail and see how they facilitate the process of loading data into Blazor Charts.
Loading IEnumerable data in the Blazor Charts
The IEnumerable data source is quite versatile. It supports all non-generic collections that can be enumerated, making it suitable for various scenarios.
Let’s populate the IEnumerable collection with predefined class properties. We will map the XName and YName properties to the x-axis and y-axis fields of our Blazor Chart component, respectively.
The IEnumerable data source can accommodate various types of data collection. including:
In the upcoming sections, we will see how these collections can be used with the IEnumerable data source in Blazor Charts.
List binding
Blazor Charts is a powerful data visualization component that enables you to display various charts in your Blazor apps. One common requirement is to populate the charts with data from a list. This article will explore how to populate list data for the Blazor Chart component.
Step 1: First, let’s create a class called Patient to represent the data we want to display in the chart. It will load data from patients’ names and their corresponding height details. Refer to the following example of the Patient class.
public class Patient
{
  public Patient(string currentName, double currentHeight)
     {
       Name = currentName;
       Height = currentHeight;
     }
       public string Name { get; set; }
       public double Height { get; set; }
}
Step 2: In your Blazor component, you need to define a property PatientData of type List<Patient> to store the list of patient details. You can populate this list with patient details from your data source or other preferred method. Refer to the following example for defining the PatientData property in your Blazor component.
public List<Patient> PatientData { get; set; }
protected override void OnInitialized()
{
   PatientData = new List<Patient>();
   PatientData.Add(new Patient("Johnson Godwin", 176));
   PatientData.Add(new Patient("Peter Jackman", 163.3));
   PatientData.Add(new Patient("James Oliver", 177));
   PatientData.Add(new Patient("Richard Joseph", 167));
   PatientData.Add(new Patient("Robert George", 178));
   PatientData.Add(new Patient("Kevin", 164));
   PatientData.Add(new Patient("Alvin", 176));
}
Step 3: Now, we can bind the PatientData property populated with the patient details to the DataSource property of the Blazor Charts. This property is responsible for providing the data to the chart. Refer to the following example to bind the list data collection to the DataSource property.
@using Syncfusion.Blazor.Charts
<SfChart Title="Patient Heights">
   ...
 <ChartSeriesCollection>
  <ChartSeries DataSource="@PatientData" XName="Name" YName="Height" Type="ChartSeriesType.Column">
  </ChartSeries>
 </ChartSeriesCollection>
</SfChart>
ExpandoObject binding
You can use dynamic objects such as ExpandoObject to populate the charts with data. This section will explore how to populate ExpandoObject data for the Blazor Charts component.
Step 1: First, create an array to store the patient data. This example will load data from patients’ names and corresponding height details. Refer to the following example to define the array.
public List<ExpandoObject> PatientData { get; set; } = new List<ExpandoObject>();

string[] patientsName = new string[]

{
   "Johnson Godwin",
   "Peter Jackman",
   "James Oliver",
   "Richard Joseph",
   "Robert George",
   "Kevin",
   "Alvin"
};

double[] patientsHeight = new double[]

{
   176,
   163.3,
   177,
   167,
   178,
   164,
   176
};
Step 2: In the Blazor component, define a property PatientData of type List<ExpandoObject> to store the patient data. You can populate this list dynamically by creating ExpandoObject instances and setting the appropriate properties. Here’s an example of populating the PatientData property in your Blazor component.
public List<ExpandoObject> PatientData { get; set; } = new List<ExpandoObject>();

protected override void OnInitialized() {
   PatientData = Enumerable.Range(0, 6).Select((x) => {
       dynamic data = new ExpandoObject();
       data.Name = patientsName[x];
       data.Height = patientsHeight[x];
       return data;
   }).Cast<ExpandoObject>().ToList<ExpandoObject>();
}
Step 3: Now, we can bind the list of the ExpandoObjects to the DataSource property of the Blazor Chart component. Refer to the code example below.
@using Syncfusion.Blazor.Charts
<SfChart Title="Patient Heights">
   ...
 <ChartSeriesCollection>
  <ChartSeries DataSource="@PatientData" XName="Name" YName="Height" Type="ChartSeriesType.Column">
  </ChartSeries>
 </ChartSeriesCollection>
</SfChart>
DynamicObject binding
You can also use dynamic objects to populate the Blazor Charts with data.
Step 1: First, create an array to store the patient data. The step is similar to ExpandoObject binding.
Refer to the following example, where we will load data in the form of patients’ names and their respective height details. Here is an example of how you can define the array.
string[] patientsName = new string[] { "Johnson Godwin", "Peter Jackman", "James Oliver", "Richard Joseph", "Robert George", "Kevin", "Alvin" };
double[] patientsHeight = new double[] { 176, 163.3, 177, 167, 178, 164, 176 };
Step 2: To populate the patient details dynamically, create a custom class called DynamicDictionary that inherits from DynamicObject. This class enables us to set and retrieve properties during runtime dynamically.
You can define a list of DynamicDictionary objects to hold the patient data. In the OnInitialized method, you can populate this list by creating new instances of DynamicDictionary and setting the properties dynamically.
public class DynamicDictionary : DynamicObject
{
   Dictionary<string, object> dictionary = new Dictionary<string, object>();
   public override bool TryGetMember(GetMemberBinder binder, out object result)
   {
            string name = binder.Name;
            return dictionary.TryGetValue(name, out result);
   }
   public override bool TrySetMember(SetMemberBinder binder, object value)
   {
            dictionary[binder.Name] = value;
            return true;
   }
   public override System.Collections.Generic.IEnumerable<string> GetDynamicMemberNames()
   {
         return this.dictionary?.Keys;
   }
}
public List<DynamicDictionary> PatientData = new List<DynamicDictionary>() { };

protected override void OnInitialized()
{
   PatientData = Enumerable.Range(0, 5).Select((x) =>
   {
       dynamic data = new DynamicDictionary();
       data.Name = patientsName[x];
       data.Height = patientsHeight[x];
       return data;
   }).Cast<DynamicDictionary>().ToList<DynamicDictionary>();

}
Step 3: To bind the DynamicObject data collection to the DataSource property, you can use the <ChartSeries> tag to configure the series for the chart. Set the DataSource property to the list of DynamicDictionary objects. The XName and YName properties map the datasource field names for the chart’s X and Y axes.
@using Syncfusion.Blazor.Charts
<SfChart Title="Patient Heights">
   ...
 <ChartSeriesCollection>
  <ChartSeries DataSource="@PatientData" XName="Name" YName="Height" Type="ChartSeriesType.Column">
  </ChartSeries>
 </ChartSeriesCollection>
</SfChart>
The following chart showcases the effectiveness of utilizing various data-populating methods discussed earlier. The chart remains consistent despite the differences in the implementation steps, whether using a List, ExpandoObject, or dynamic objects.

Loading remote data in the Blazor Charts
Blazor Charts can easily handle remote data by using Syncfusion.Blazor.Data package. To bind remote data to the chart, you can assign the service data as an instance of the SfDataManager class to the DataSource property. To communicate with a remote data source, specify the endpoint URL and choose the appropriate adaptor type based on your data.
In the following example, we will fetch data from a specific URL and use the Web API Adaptor.
Step 1: Include the following namespaces to use the SfDataManager class and adapters.
@using Syncfusion.Blazor
@using Syncfusion.Blazor.Data
Step 2: Within the Chart component, add the SfDataManager tag and specify the service url and adapter type properties as follows.
<SfChart>
 <SfDataManager Url="https://blazor.syncfusion.com/services/production/api/chart" Adaptor="Adaptors.WebApiAdaptor"></SfDataManager>
    ...
</SfChart>
Step 3: Next, within the Chart component, configure the ChartSeries by setting the XName and YName values to map the appropriate properties from the remote data. Additionally, specify the desired chart series type as follows.
<SfChart>
 <SfDataManager Url="https://blazor.syncfusion.com/services/production/api/chart" Adaptor="Adaptors.WebApiAdaptor"></SfDataManager>
    ...
 <ChartSeriesCollection>
  <ChartSeries XName="FoodName" YName="Price" Type="ChartSeriesType.Column">
  </ChartSeries>
 </ChartSeriesCollection>
</SfChart>
The following image shows the chart rendered using the remote data.

Loading JSON data in the Blazor Charts
JSON (JavaScript Object Notation) is a lightweight data-interchange format that allows for structured data storage. Like other data formats, you can map the locally converted field names to the XName and YName properties of the Blazor Charts.
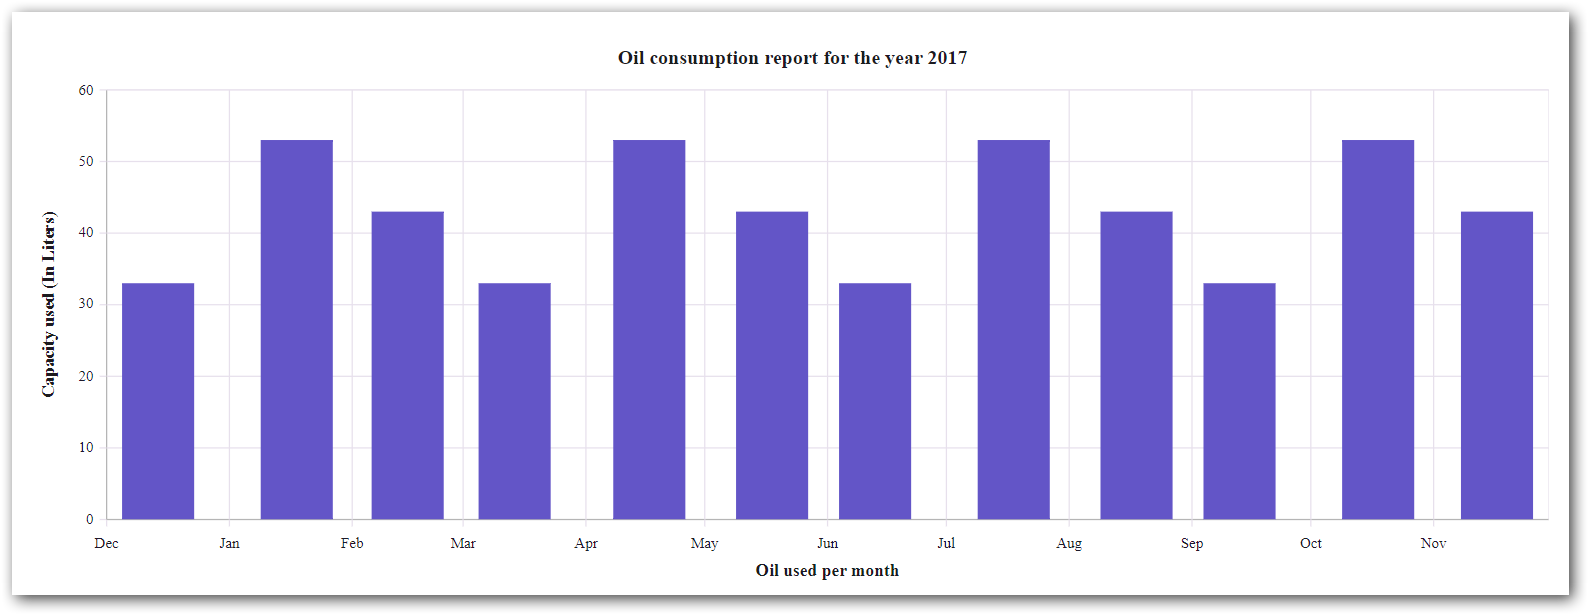
Let’s see how to bind JSON data for monthly oil consumption to the chart.
Step 1: First, deserialize the JSON data into your local business object, OilDetail.
In the following example, the classes HttpClient and NavigationManager are injected into our Blazor component.
@inject NavigationManager NavigationManager
@inject HttpClient Http
...
public OilDetail[] OilData { get; set; }
protected async override Task OnInitializedAsync()
{
   OilData = new OilDetail[] { };
   OilData = await Http.GetFromJsonAsync<OilDetail[]>(NavigationManager.BaseUri + "data/oildata.json");
}
Step 2: Now, bind the deserialized JSON data stored in the OilData property of the Blazor Charts component.
<SfChart Title="Oil consumption report for the year 2017" Theme="Syncfusion.Blazor.Theme.Material3">
 <ChartPrimaryYAxis Title="Capacity used (In Liters)">
 </ChartPrimaryYAxis>
 <ChartPrimaryXAxis ValueType="Syncfusion.Blazor.Charts.ValueType.DateTime" Title="Oil used per month">
 </ChartPrimaryXAxis>
 <ChartSeriesCollection>
  <ChartSeries DataSource="@OilData" XName="Date" YName="CapacityUsed" Type="ChartSeriesType.Column">
  </ChartSeries>
 </ChartSeriesCollection>
</SfChart>
Refer to the following image.
Loading observable collection in the Blazor Charts
The ObservableCollection class in Blazor provides notifications when items are added, removed, or moved, making it ideal for creating observable charts. By implementing the INotifyCollectionChanged interface, the ObservableCollection also provides notifications for dynamic changes such as adding, removing, moving, and clearing the collection.
This section will create a dynamic column chart using an ObservableCollection to display patient heights.
Step 1: To populate the chart with patient height details, define the PatientDetail class with Name and Height properties.
Refer to the code example below.
public class PatientDetail
{
        public string Name { get; set; }
        public double Height { get; set; }
        public static ObservableCollection<PatientDetail> GetData()
        {
            ObservableCollection<PatientDetail> ChartPoints = new ObservableCollection<PatientDetail>()
            {
                new PatientDetail { Name = "Johnson Godwin", Height = 176 },
                new PatientDetail { Name = "Peter Jackman", Height = 163.3 },
                new PatientDetail { Name = "James Oliver", Height = 177 },
                new PatientDetail { Name = "Richard Joseph", Height = 167 },
                new PatientDetail { Name = "Robert George", Height = 178 },
                new PatientDetail { Name = "Kevin", Height = 164 },
                new PatientDetail { Name = "Alvin", Height = 176 },
            };
            return ChartPoints;
        }
}
Step 2: To bind the patient data to the chart, set the PatientData property to the collection returned by the GetData method. This can be achieved using the OnInitialized lifecycle method or any appropriate event handler.
public ObservableCollection<PatientDetail> PatientData { get; set; }
protected override void OnInitialized()
{
    this.PatientData = PatientDetail.GetData();
}
Step 3: Finally, we bind the PatientData ObservableCollection to the Chart’s DataSource property. We map the XName and YName properties to the Name and Height fields from the PatientDetail class.
@using Syncfusion.Blazor.Charts
<SfChart Title="Patient Heights">
   ...
 <ChartSeriesCollection>
  <ChartSeries DataSource="@PatientData" XName="Name" YName="Height" Type="ChartSeriesType.Column">
  </ChartSeries>
 </ChartSeriesCollection>
</SfChart>
Refer to the following chart.

Loading SQL data in Blazor Charts
SQL provides a standardized way to interact with databases, execute queries, and perform operations like creating tables, defining relationships, and extracting meaningful insights from data.
This section will explore how to create a column chart in a Blazor app by fetching data from the SQL table. This chart displays the literacy rate of multiple countries.
Step 1: First, create a model class named LiteracyRateModel that represents the structure of your SQL table.
public class LiteracyRateModel
{
    public string Country { get; set; }
    public double Rate { get; set; }
}
Step 2: Import the necessary namespaces and define a property to store the fetched data.
Refer to the following code example.
@using Syncfusion.Blazor.Charts
@using System.Data.SqlClient
…
private List<LiteracyRateModel> LiteracyRateDetails;
…
Step 3: Then, establish a connection to the SQL database, query the table, and read the data into the component’s data property.
protected override async Task OnInitializedAsync()
{
   string connectionString = "Your SQL connection string";
   string query = "SELECT * FROM Your Table Name";
   using (SqlConnection connection = new SqlConnection(connectionString))
   {
     await connection.OpenAsync();
     using (SqlCommand command = new SqlCommand(query, connection))
     {
       SqlDataReader reader = await command.ExecuteReaderAsync();
       if (reader.HasRows)
       {
         LiteracyRateDetails = new List<LiteracyRateModel>();
         while (await reader.ReadAsync())
         {
           LiteracyRateModel record = new LiteracyRateModel
           {
             Country = reader.GetString(1),
             Rate = reader.GetDouble(2),
           };
           LiteracyRateDetails.Add(record);
         }
       }
       await reader.CloseAsync();
     }
     await connection.CloseAsync();
   }
}
Step 4: Finally, bind the fetched data property (LiteracyRateDetails) to the chart’s DataSource property. Map the XName and YName properties to the Country and Rate fields from the LiteracyRateModel class.
<SfChart Title="Literacy Rate by Country">
 <ChartPrimaryXAxis ValueType="Syncfusion.Blazor.Charts.ValueType.Category">
 </ChartPrimaryXAxis>
 <ChartSeriesCollection>
  <ChartSeries DataSource="@LiteracyRateDetails" XName="Country" YName="Rate" Type="ChartSeriesType.Column">
  </ChartSeries>
 </ChartSeriesCollection>
</SfChart>
Refer to the following chart, which displays the literacy rates of multiple countries in a column chart.

Blazor Charts component enables developers to visualize data from different data sources. Their flexibility allows for tailored approaches based on specific requirements. Experiment with different data-populating methods to find the optimal solution for your project. Blazor Charts offers endless possibilities for creating engaging and dynamic chart visualizations.
GitHub reference
You can check out the complete code example from this article on GitHub.

Syncfusion Blazor components can be transformed into stunning and efficient web apps.
Conclusion
Thank you for reading! In this blog, you have seen how to load data from various data sources in Blazor Charts. Try them out and leave your feedback in the comments section below!
Explore our Blazor Chart examples to learn more about the supported chart types and how easy it is to configure them for stunning visual effects.
The latest version of the Blazor Charts component is available for existing customers from the License and Downloads page. If you are not a Syncfusion customer, try our 30-day free trial.
Also, you can contact us through our support forums, support portal, or feedback portal. We are always happy to assist you!
Related blogs
- Advanced Query Building Techniques: Connecting Tables with Joins using Blazor Query Builder
- Creating Custom Forms and Validation in a Blazor Hybrid App
- Load Appointments on Demand in Blazor Scheduler using Entity Framework Core
- Create Interactive Floor Planner Diagrams using Blazor Diagram Library
