The Syncfusion Angular Charts component is a powerful tool for visualizing and presenting data. While charts are a great way to display information, they can become sluggish and difficult to manage when dealing with extensive data sets. This is where the lazy loading features come into play.
Lazy loading displays data based on user-defined criteria, such as a specified range or the number of data points to be displayed, instead of loading all records simultaneously. Lazy loading ensures that only the data within the current range or point count is rendered in the Charts while scrolling.
This blog will explore how lazy loading features can significantly improve performance and enhance the user experience when working with substantial data in Angular Charts.
Note: If you’re new to our Angular Charts, we recommend going through its documentation before proceeding.
Getting started with lazy loading in Angular Charts
As we get started, our primary focus will be on understanding and implementing point length and range.
Using point length
With the point length concept in lazy loading, we can streamline the process of loading and displaying specific data segments from the data source on a chart. As users interact and scroll through the chart, the scrollEnd event is triggered, dynamically fetching and rendering the subsequent batch of data.
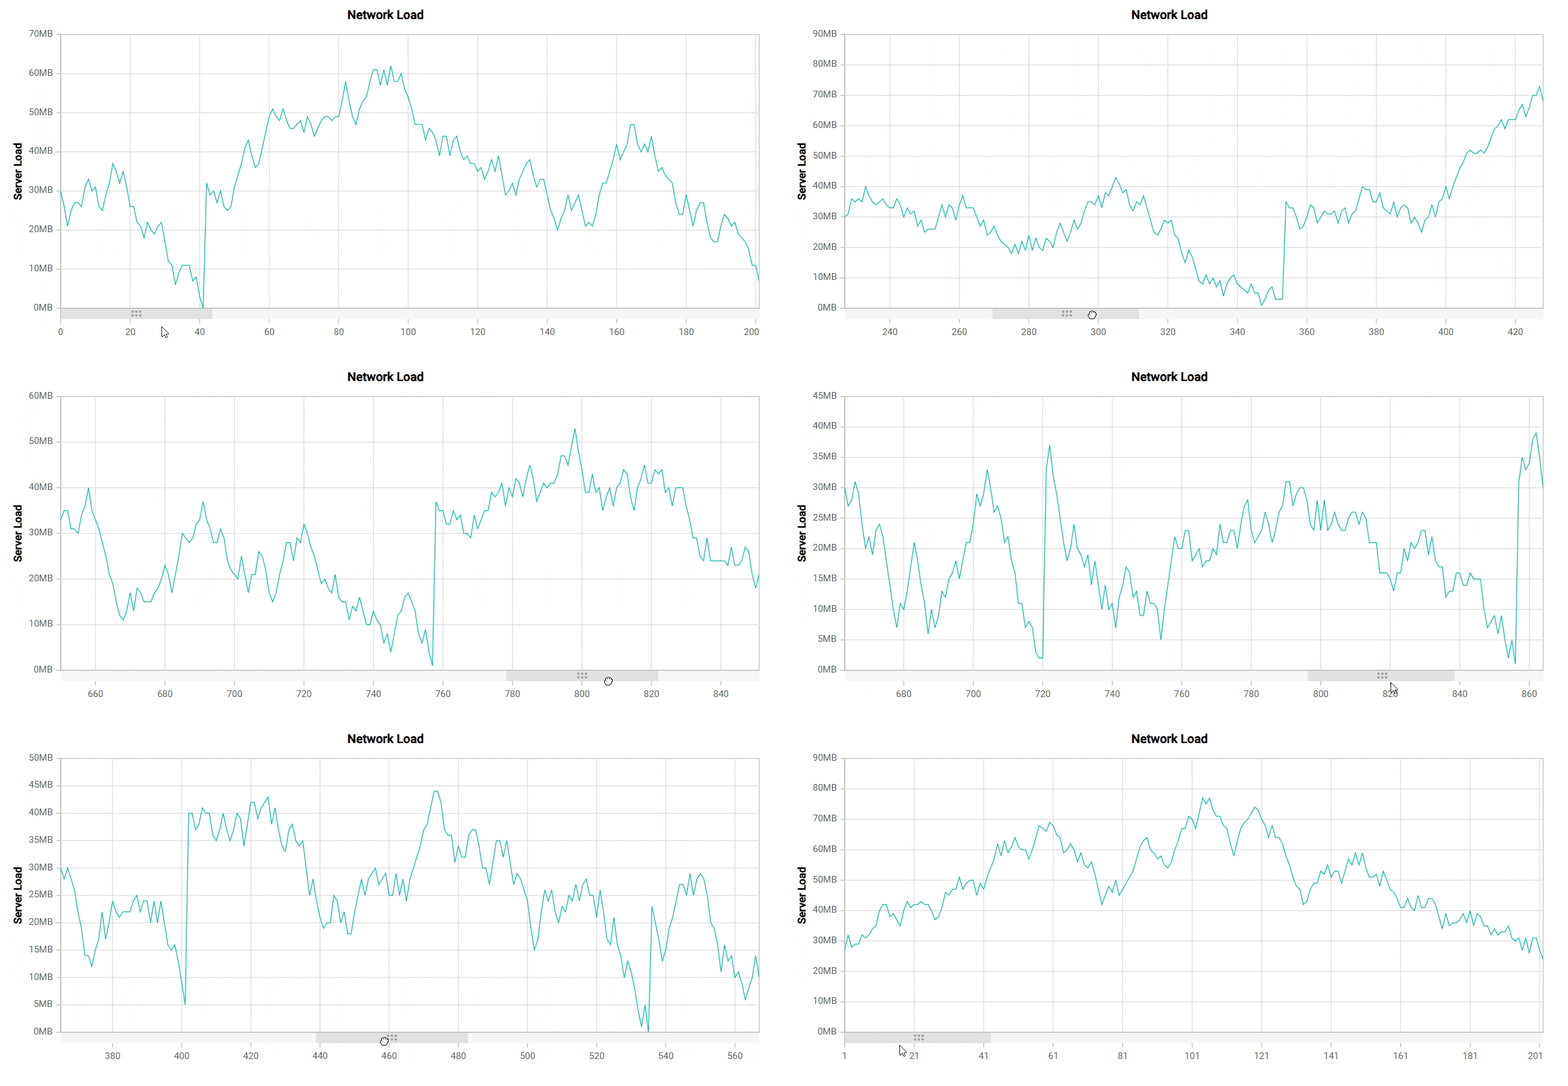
Let’s examine a practical example of this data-loading mechanism based on point length. In our initial load, we only loaded 200 data points out of the 1,000 available in the data source into the chart. As a result, only the initially loaded data will be visible to users. The scrollEnd event is activated as users scroll through, providing start and end values for the next data set. These values can be leveraged to load and populate the chart with pertinent data.
Refer to the following code example.
import { Component, OnInit } from '@angular/core';
import { lineData } from './datasource';
@Component({
    selector: 'app-container',
    template: `<ejs-chart id="chart-container" [primaryXAxis]='primaryXAxis' (scrollEnd)='scrollEnd($event)'>
        <e-series-collection>
            <e-series [dataSource]='data' type='Line' xName='x' yName='y'></e-series>
        </e-series-collection>
    </ejs-chart>`
})
export class AppComponent implements OnInit {
    public chartData?: Object[];
    public primaryXAxis?: Object;
        public data: Object[] = this.GetNumericData(1, 200);
    ngOnInit(): void {
        this.chartData = lineData;
        this.primaryXAxis = {
            scrollbarSettings: { pointsLength: 1000 }
        };
    }
    public scrollEnd(args: IScrollEventArgs): void {
         //Assigning the next set of data to the chart based on the minimum and maximum values.
          this.chart.series[0].dataSource = this.GetNumericData(args.currentRange.minimum as number,  args.currentRange.maximum as number);
        this.chart.dataBind();
    };
}

public GetNumericData(start: number, end: number): { x: number, y: number }[] {
        let series: { x: number, y: number }[] = [];
        let value: number = 30;
        for (let i: number = start; i <= end; i++) {
            if (Math.random() > .5) {
                value += (Math.random() * 10 - 5);
            } else {
                value -= (Math.random() * 10 - 5);
            }
            if (value < 0) {
                value = this.getRandomInt(20, 40);
            }
            let point: { x: number, y: number } = { x: i, y: Math.round(value) };
            series.push(point);
        }
        return series;
}
Refer to the following output image.

Using range
We can load and display a specific data range from the data source in a chart with the range concept in lazy loading. The scrollEnd event is triggered as users scroll, which dynamically loads and presents the subsequent data range.
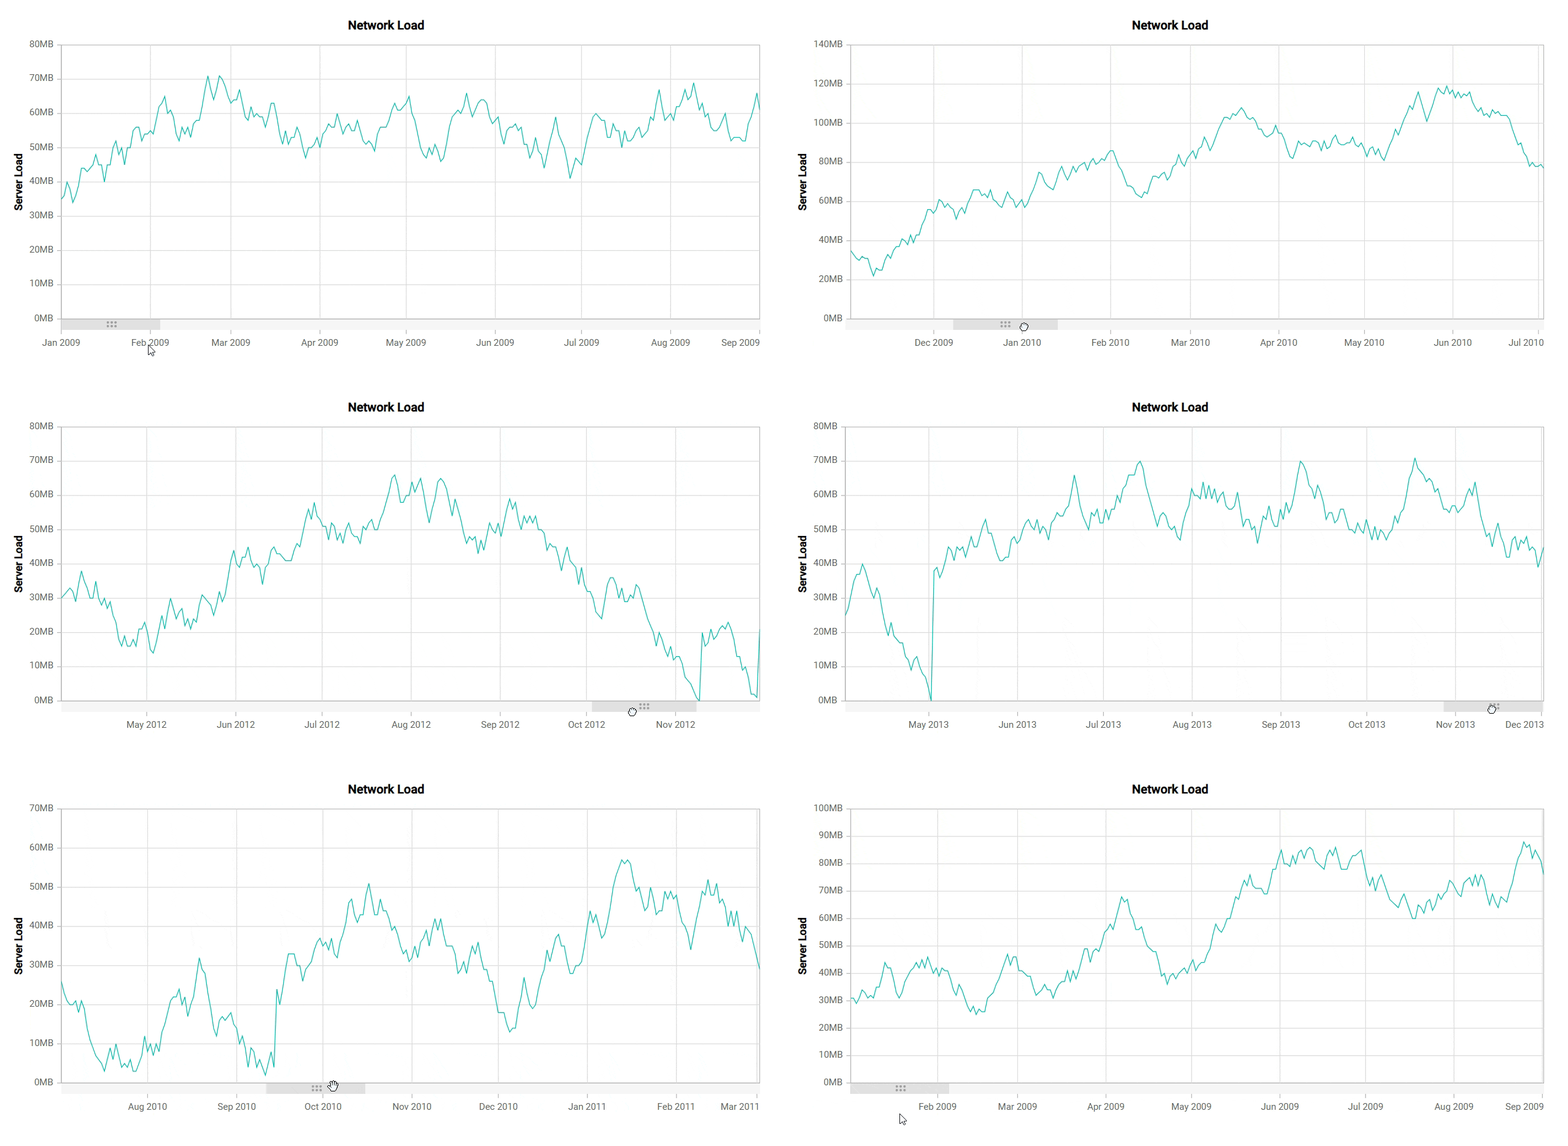
For instance, in the following code example, we initially loaded data from January 1, 2009, to September 1, 2009. Consequently, only the data falling within this specified range will be visible. As users scroll, the ScrollEnd event will be triggered, providing the range for the next set of data. You can use these range values to load and populate the chart with the relevant data.
Refer to the following code example.
import { Component, OnInit } from '@angular/core';
import { lineData } from './datasource';
@Component({
    selector: 'app-container',
    template: `<ejs-chart id="chart-container" [primaryXAxis]='primaryXAxis' (scrollEnd)='scrollEnd($event)'>
        <e-series-collection>
         <e-series [dataSource]='chartData' type='Line' xName='x' yName='y'></e-series>
        </e-series-collection>
    </ejs-chart>`
})
export class AppComponent implements OnInit {
    public chartData?: Object[];
    public primaryXAxis?: Object;
    public data: Object[] = this.GetDateTimeData(new Date(2009, 0, 1), new Date(2009, 8, 1));
    ngOnInit(): void {
        this.chartData = lineData;
        this.primaryXAxis = {
            scrollbarSettings: {
                 range: {
                     minimum: new Date(2009, 0, 1),
                     maximum: new Date(2014, 0, 1)
                 },
            }
        };
    }
   public scrollEnd(args: IScrollEventArgs): void {
        //Assigning next set of data to the chart based on the new range.
         this.chart.series[0].dataSource = this.GetDateTimeData(args.currentRange.minimum as Date, args.currentRange.maximum as Date);
        this.chart.dataBind();
   };
}

public GetDateTimeData(start: Date, end: Date): { x: Date, y: number }[] {
        let series: { x: Date, y: number }[] = [];
        let date: number;
        let value: number = 30;
        let option: DateFormatOptions = {
            skeleton: 'full',
            type: 'dateTime'
        };
        let dateParser: Function = this.intl.getDateParser(option);
        let dateFormatter: Function = this.intl.getDateFormat(option);
        for (let i: number = 0; start <= end; i++) {
            date = Date.parse(dateParser(dateFormatter(start)));
            if (Math.random() > .5) {
                value += (Math.random() * 10 - 5);
            } else {
                value -= (Math.random() * 10 - 5);
            }
            if (value < 0) {
                value = this.getRandomInt(20, 40);
            }
            let point: { x: Date, y: number } = { x: new Date(date), y: Math.round(value) };
            new Date(start.setDate(start.getDate() + 1));
            series.push(point);

        return series;
}
Refer to the following output image.

References
For more details, refer to the lazy loading in the Angular Charts demo and documentation.
Conclusion
Thanks for reading! In this blog, we’ve seen how the lazy-loading feature helps us enhance performance and the user experience in the Angular Charts component. We appreciate your feedback, which you can leave in the comments section below.
You can download our free trial if you do not have a Syncfusion license but wish to try the Charts component.
For questions, you can contact us via our support forums, support portal, or feedback portal. We are always happy to assist you!
Related blogs
- Easily Build an Interactive BPMN Viewer and Editor in Angular
- A Full-Stack Web App Using Angular and GraphQL: Part 1
- What’s New in Angular Charts: 2023 Volume 3
- Build Multi-Parent Hierarchical Trees with Angular Diagram Library


