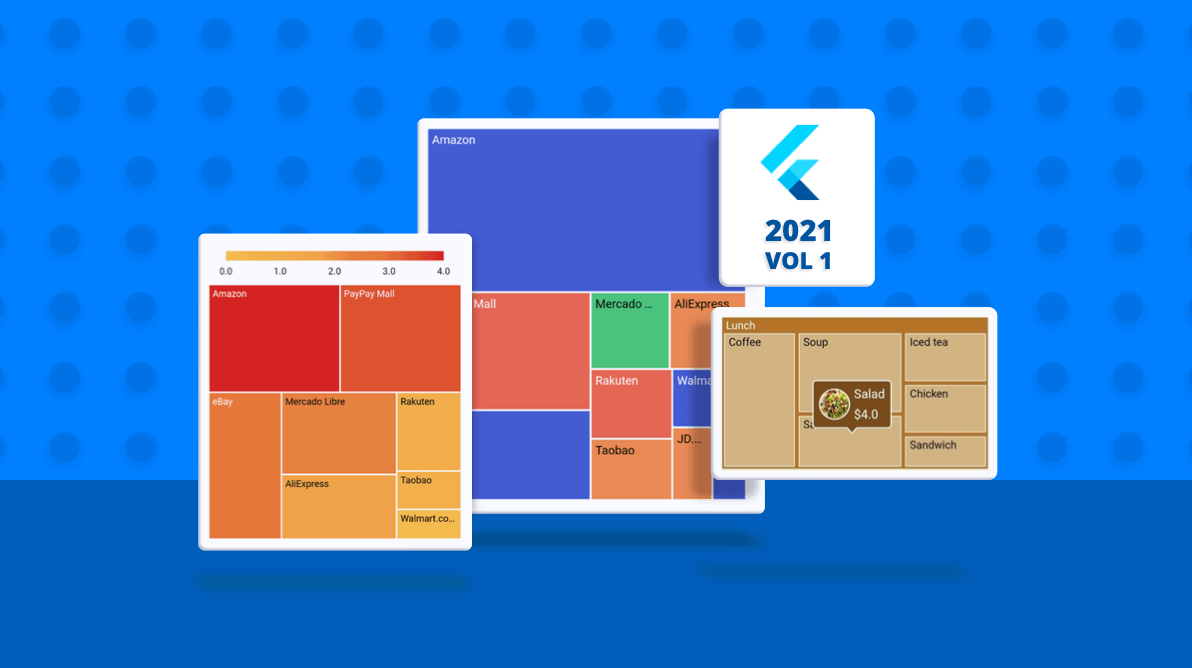
As an addition to our existing gallery of Flutter widgets, we have added another popular data visualization widget in our 2021 Volume 1 release, Treemap. It visualizes flat and hierarchical data as rectangles that are sized and colored based on quantitative variables.
In this blog post, we will see an overview of the features included in the Flutter Treemap and how to get started with this new widget.
Different layouts
You can use layouts, namely squarified, slice, and dice, based on different algorithms for Treemap rendering.
Squarified
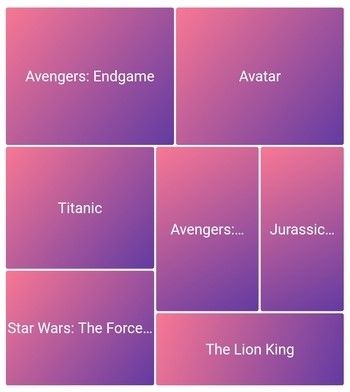
This layout arranges rectangles that are determined by the quantitative variable in a row and wrap them to the next row, depending on the available space.
Slice
This layout arranges all rectangles horizontally. The size of each rectangle is determined by the quantitative variable and available height.

Dice
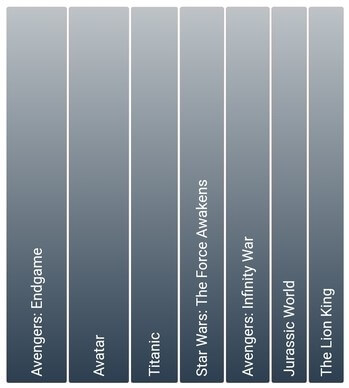
This layout arranges all rectangles vertically. The size of each rectangle is determined by the quantitative variable and the available width.
Labels
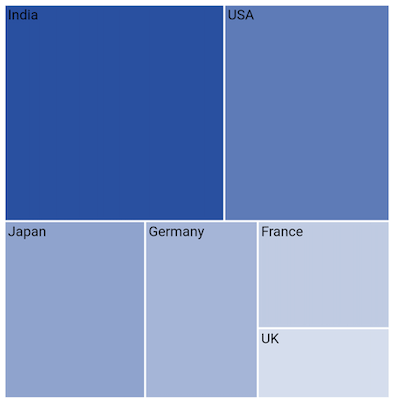
Add any type of custom widget, typically a text widget, to improve the readability of individual tiles by providing brief descriptions as labels. It is also possible to position these custom widgets freely in the available space.
Levels
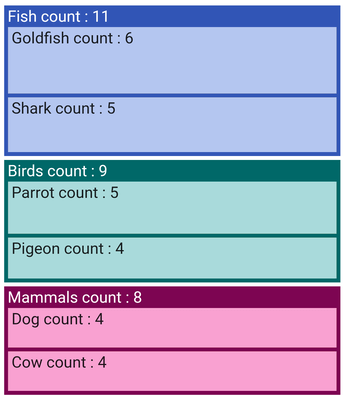
This feature supports visualizing both the single and multiples levels of data.
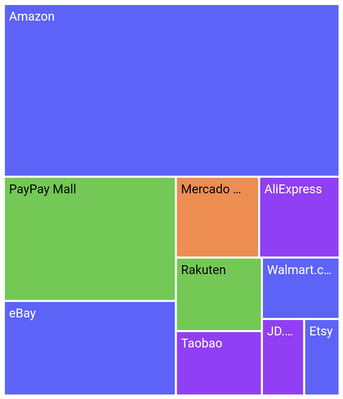
Flat data
You can visualize a flat data collection.
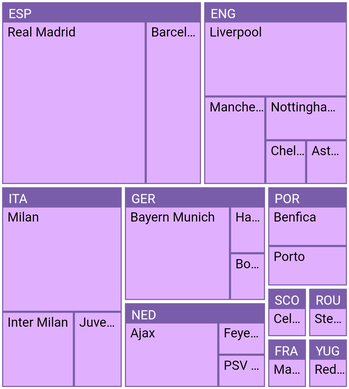
Hierarchical data
You can also arrange tiles in the form of nested rectangles. Each tile is filled with smaller rectangles representing subdata. You can have more than one level to form a hierarchical tree map.
Colors
Categorize the tiles on the Treemap widget by customizing their color based on levels. You can set the tile color for a specific value or for a range of values.
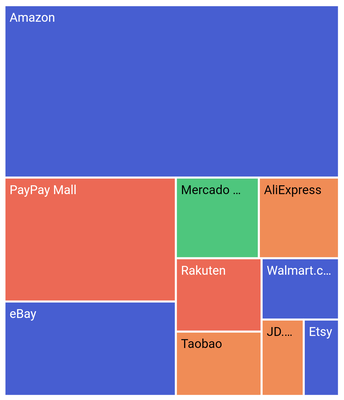
Value color mapping
With this feature, you can apply a specific color to a tile based on its data. For example, you can apply colors to countries based on their membership status in an organization.
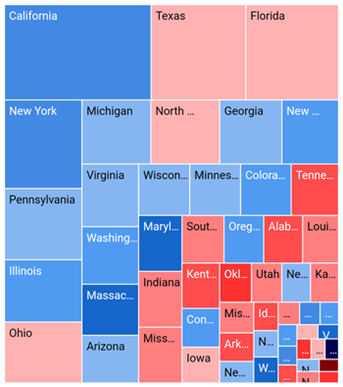
Range color mapping
With this feature, you can easily apply colors to tiles if their data falls within a specific range. For example, you can apply colors to countries based on their population density.
Legend
Legends in the Treemap clearly provide information about data plotted in it.

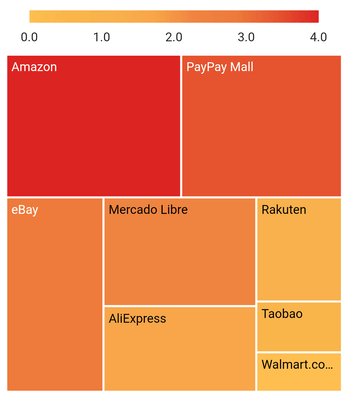
Solid bar legend
You can also render a legend as a bar and customize the positions of its labels as needed. Use gradients as the legend bar background to show changes in regional data.
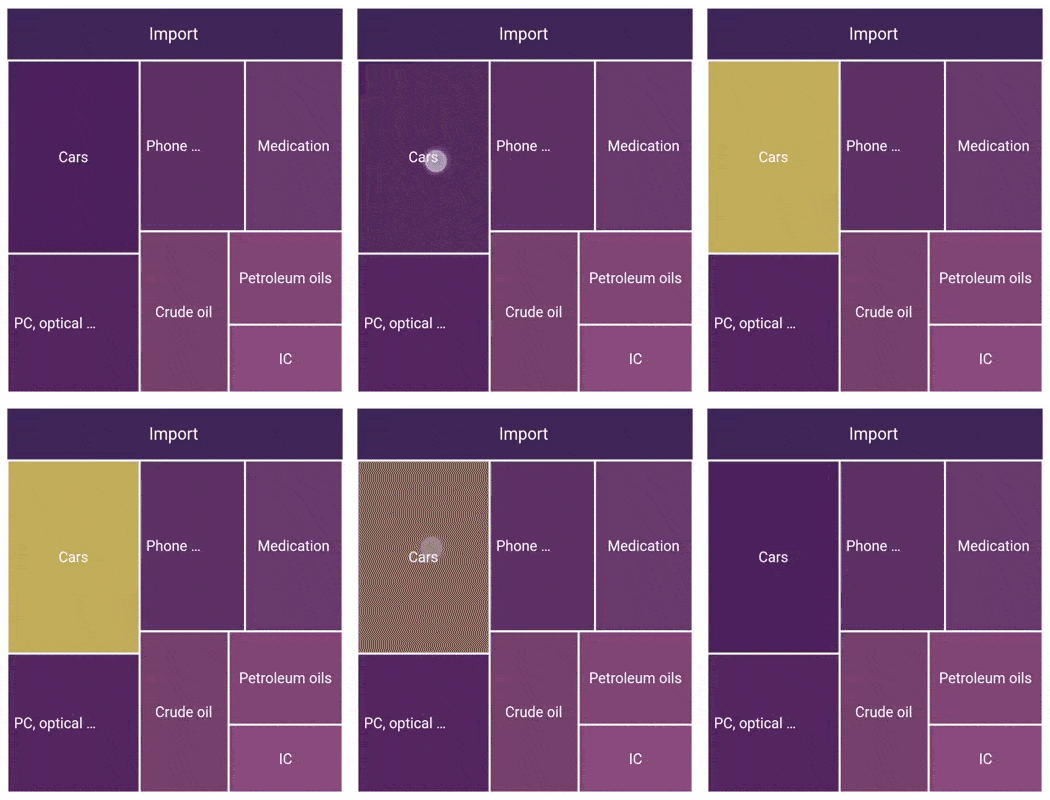
Selection
This feature highlights a tile when we tap or click on it. During this interaction, it also allows functionalities like page transitions, showing detailed information about a selected area, and more.
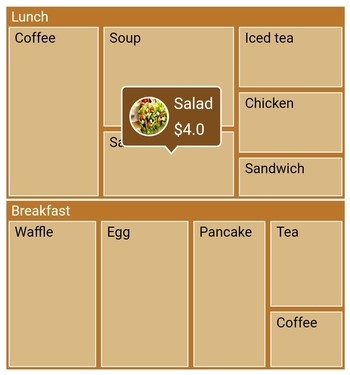
Tooltip
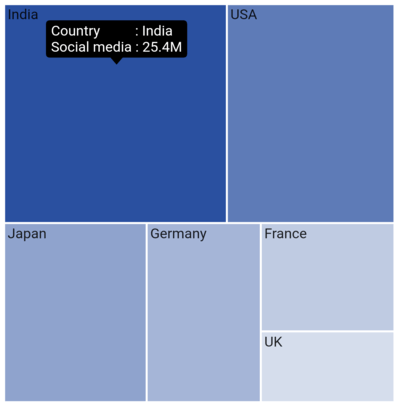
Display additional information about a tile using a completely customizable tooltip on the Treemap widget. You can customize the background color, stroke and corner radius of the tooltip.
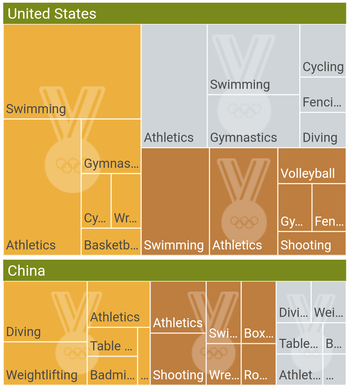
Custom background
You can add any type of custom widget, such as an image widget, as a tile background to enrich the UI and enhance data visualization.
Add Flutter Treemap to your application
This section explains how to add the Flutter Treemap widget to your application and use its basic features.
Step 1: Create a basic Flutter application.
First things first, create a simple Flutter project with the instructions provided in Get started with your first Flutter app documentation.
Step 2: Add Flutter Treemap dependency.
Add the Syncfusion Flutter Treemap dependency in your pubspec.yaml file using the following code.
dependencies:
  syncfusion_flutter_treemap: ^19.1.55-beta
  //Use the latest available version.
Step 3: Get the packages.
Then, run the following command to get the required packages.
$ flutter pub get |
Step 4: Import Flutter Treemap package.
Now, import the library using the following code.
import 'package:syncfusion_flutter_treemap/treemap.dart';Step 5: Initialize Treemap and populate the data source.
After importing the package, initialize the Treemap widget as a child of any widget.
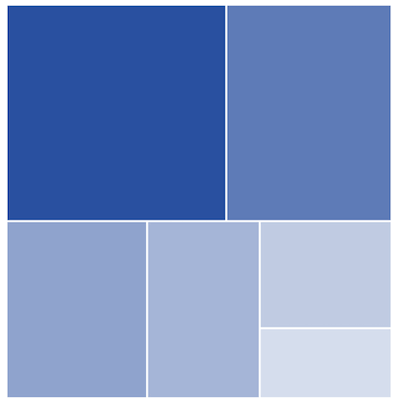
To populate the data source, set its count to the dataCount property of the Treemap. Then, the data will be grouped based on the values returned from the TreemapLevel.groupMapper callback. The quantitative value of the underlying data has to be returned from the weightValueMapper callback. Based on this value, every tile (rectangle) size will be rendered. You can have more than one TreemapLevel in the levels collection to form a hierarchical tree map.
Refer to the following code example.
late List _source;

@override
void initState() {
   _source = [
      SocialMediaUsers(
          country: 'India', socialMedia: 'Facebook', usersInMillions: 25.4),
      SocialMediaUsers(
          country: 'USA', socialMedia: 'Instagram', usersInMillions: 19.11),
      SocialMediaUsers(
          country: 'Japan', socialMedia: 'Facebook', usersInMillions: 13.3),
      SocialMediaUsers(
          country: 'Germany', socialMedia: 'Instagram', usersInMillions: 10.65),
      SocialMediaUsers(
          country: 'France', socialMedia: 'Twitter', usersInMillions: 7.54),
      SocialMediaUsers(
          country: 'UK', socialMedia: 'Instagram', usersInMillions: 4.93),
   ];
   super.initState();
}

@override
Widget build(BuildContext context) {
  return Scaffold(
     body: Center(
        child: Padding(
          padding: EdgeInsets.all(10),
          child: SfTreemap(
            dataCount: _source.length,
            weightValueMapper: (int index) {
              return _source[index].usersInMillions;
            },
            levels: [
              TreemapLevel(
                groupMapper: (int index) {
                  return _source[index].country;
                },
              ),
            ],
          ),
        ),
      ),
   );
}

class SocialMediaUsers {
  const SocialMediaUsers({
    required this.country,
    required this.socialMedia,
    required this.usersInMillions,
  });

  final String country;
  final String socialMedia;
  final double usersInMillions;
}
Step 6: Add labels.
Then, add any type of custom widget to the tiles based on the index using the TreemapLevel.labelBuilder property.
Refer to the following code.
late List _source;

@override
void initState() {
   _source = [
      SocialMediaUsers(
          country: 'India', socialMedia: 'Facebook', usersInMillions: 25.4),
      SocialMediaUsers(
          country: 'USA', socialMedia: 'Instagram', usersInMillions: 19.11),
      SocialMediaUsers(
          country: 'Japan', socialMedia: 'Facebook', usersInMillions: 13.3),
      SocialMediaUsers(
          country: 'Germany', socialMedia: 'Instagram', usersInMillions: 10.65),
      SocialMediaUsers(
          country: 'France', socialMedia: 'Twitter', usersInMillions: 7.54),
      SocialMediaUsers(
          country: 'UK', socialMedia: 'Instagram', usersInMillions: 4.93),
   ];
   super.initState();
}

@override
Widget build(BuildContext context) {
  return Scaffold(
     body: Center(
        child: Padding(
          padding: EdgeInsets.all(10),
          child: SfTreemap(
            dataCount: _source.length,
            weightValueMapper: (int index) {
              return _source[index].usersInMillions;
            },
            levels: [
              TreemapLevel(
                groupMapper: (int index) {
                  return _source[index].country;
                },
                labelBuilder: (BuildContext context, TreemapTile tile) {
                  return Padding(
                    padding: EdgeInsets.only(left: 2.5, right: 2.4, top: 1),
                    child: Text(tile.group),
                  );
                },
              ),
            ],
          ),
        ),
      ),
   );
}

class SocialMediaUsers {
   const SocialMediaUsers({
     required this.country,
     required this.socialMedia,
     required this.usersInMillions,
   });

   final String country;
   final String socialMedia;
   final double usersInMillions;
}
Step 7: Add tooltip.
Now, enable the tooltip in the tree map and return the completely customized widget using the tooltipBuilder property.
Refer to the following code.
late List _source;

@override
void initState() {
    _source = [
      SocialMediaUsers(
          country: 'India', socialMedia: 'Facebook', usersInMillions: 25.4),
      SocialMediaUsers(
          country: 'USA', socialMedia: 'Instagram', usersInMillions: 19.11),
      SocialMediaUsers(
          country: 'Japan', socialMedia: 'Facebook', usersInMillions: 13.3),
      SocialMediaUsers(
          country: 'Germany', socialMedia: 'Instagram', usersInMillions: 10.65),
      SocialMediaUsers(
          country: 'France', socialMedia: 'Twitter', usersInMillions: 7.54),
      SocialMediaUsers(
          country: 'UK', socialMedia: 'Instagram', usersInMillions: 4.93),
    ];
    super.initState();
}

@override
Widget build(BuildContext context) {
  return Scaffold(
     body: Center(
        child: Padding(
          padding: EdgeInsets.all(10),
          child: SfTreemap(
            dataCount: _source.length,
            weightValueMapper: (int index) {
              return _source[index].usersInMillions;
            },
            tooltipSettings: TreemapTooltipSettings(color: Colors.black),
            levels: [
              TreemapLevel(
                groupMapper: (int index) {
                  return _source[index].country;
                },
                labelBuilder: (BuildContext context, TreemapTile tile) {
                  return Padding(
                    padding: EdgeInsets.only(left: 2.5, right: 2.4, top: 1),
                    child: Text(tile.group),
                  );
                },
                tooltipBuilder: (BuildContext context, TreemapTile tile) {
                  return Padding(
                    padding: const EdgeInsets.only(
                         left: 5, right: 5, top: 2, bottom: 3),
                    child: Text(
                        'Country : ${tile.group}\nSocial media : ${tile.weight}M',
                        style: TextStyle(color: Colors.white)),
                  );
                },
              ),
            ],
          ),
        ),
      ),
   );
}

class SocialMediaUsers {
  const SocialMediaUsers({
    required this.country,
    required this.socialMedia,
    required this.usersInMillions,
  });

  final String country;
  final String socialMedia;
  final double usersInMillions;
}
Conclusion
In this blog post, we walked you through the new Syncfusion Flutter Treemap widget available in our 2021 Volume 1 release. It helps you to easily visualize both the flat and hierarchical data with its custom, vivid features. So, try this widget and share your feedback in the comments section below. You can check out the other new widgets and features added in this release on our Release Notes and What’s New page.
Check out the complete user guide for using Flutter Treemap and example projects. Additionally, you can check out our demo apps in Google Play Store, the App Store, and on our website.
If you need a new widget for the Flutter framework or new features in our existing widgets, you can contact us through our support forum, Direct-Trac, or feedback portal. As always, we are happy to assist you!

