TL;DR: Integrate Supabase with the Syncfusion Flutter Charts widget to manage real-time chart data. This guide covers setting up Supabase, fetching data, displaying it on a chart, and efficiently performing CRUD actions.
The Syncfusion Flutter Charts is one of the most versatile and rich data visualization packages, offering extensive customization and extensibility options.
This blog will show you how to integrate Supabase with the Syncfusion Flutter Charts. You will learn to set up Supabase, fetch data from the Supabase database, display it in a chart, and manage data points efficiently with CRUD operations.
Let’s get started!
Step 1: Adding dependencies
To get started, add the necessary dependencies supabase_flutter and syncfusion_flutter_charts in your pubspec.yaml file.
dependencies:
  syncfusion_flutter_charts: *.*.*
  supabase_flutter: *.*.*
Step 2: Initialize Supabase in Flutter
Now, initialize Supabase in your Flutter app using the initialize() method. Provide the url and anonKey from your Supabase dashboard, which serves as the entry point to the Supabase ecosystem.
Refer to the following code example.
Future<void> main() async {
  WidgetsFlutterBinding.ensureInitialized();
  await Supabase.initialize(
    url: 'YOUR_SUPABASE_URL',
    anonKey: 'YOUR_SUPABASE_ANON_KEY',
  );
  runApp(MyApp());
}
Step 3: Fetch data and display it in the Flutter Charts
To fetch data from Supabase, create a Supabase client instance and access the desired table by specifying its table_name. Use the stream method and pass a list of primary key column names to the primaryKey property. The primary key column contains unique values, which are used to update and delete records internally as the library receives real-time updates.
final Stream<List<Map<String, dynamic>>> _future =
      supabase.from('table_name').stream(primaryKey: ['primary_key']);
  final SupabaseClient _client = Supabase.instance.client;
Next, use the StreamBuilder and assign the stream value obtained previously. The StreamBuilder continuously listens to the stream and rebuilds its widget subtree whenever new data is updated. As a result, whenever the table is updated with new values, the chart will reflect these changes in real time.
StreamBuilder<List<Map<String, dynamic>>>(
  stream: _future,
  builder: (BuildContext context,
    AsyncSnapshot<List<Map<String, dynamic>>> snapshot) {
    // Return widget
  },
),
Then, check the snapshot argument from the StreamBuilder. If no data is available, return a CircularProgressIndicator widget until the data is received. Once the data is fetched, return the SfCartesianChart widget after converting the List<Map<String, dynamic>> type into List<ChartData> and map the data.
Here, we’ll use the ColumnSeries and set the primaryXAxis as DateTimeCategoryAxis for better data visualization.
Refer to the following code example.
List<ChartData> _chartData = <ChartData>[];

StreamBuilder<List<Map<String, dynamic>>>(
  stream: _future,
  builder: (BuildContext context,
   AsyncSnapshot<List<Map<String, dynamic>>> snapshot) {
    if (!snapshot.hasData) {
      return const Center(child: CircularProgressIndicator());
    }
    final countries = snapshot.data!;
    _chartData =
        countries.map((e) => ChartData.fromSnapShot(e)).toList();
    return SfCartesianChart(
      primaryXAxis: const DateTimeCategoryAxis(),
      series: <CartesianSeries>[
        ColumnSeries<ChartData, DateTime>(
          animationDuration: 0,
          dataSource: _chartData,
          xValueMapper: (ChartData data, int index) =>
              data.timestamp,
          yValueMapper: (ChartData data, int index) =>
              data.yValue,
        )
      ],
    );
  },
)
We’ll also create a custom data model class with a factory constructor to convert the Map<String, dynamic> type data into ChartData format.
// Custom data model class with constructor to convert the data from snapshot.
class ChartData {
  ChartData({
    required this.id,
    required this.timestamp,
    required this.yValue,
  });

  num id;
  DateTime timestamp;
  num yValue;

  static ChartData fromSnapShot(Map<String, dynamic> dataSnapshot) {
    return ChartData(
        id: dataSnapshot['id'],
        timestamp: DateTime.parse(dataSnapshot['date']),
        yValue: dataSnapshot['yValue']);
  }
}
Step 4: Performing CRUD actions
Let’s manage the chart data efficiently by performing CRUD operations: Create, Read, Update, and Delete.
Add a data point
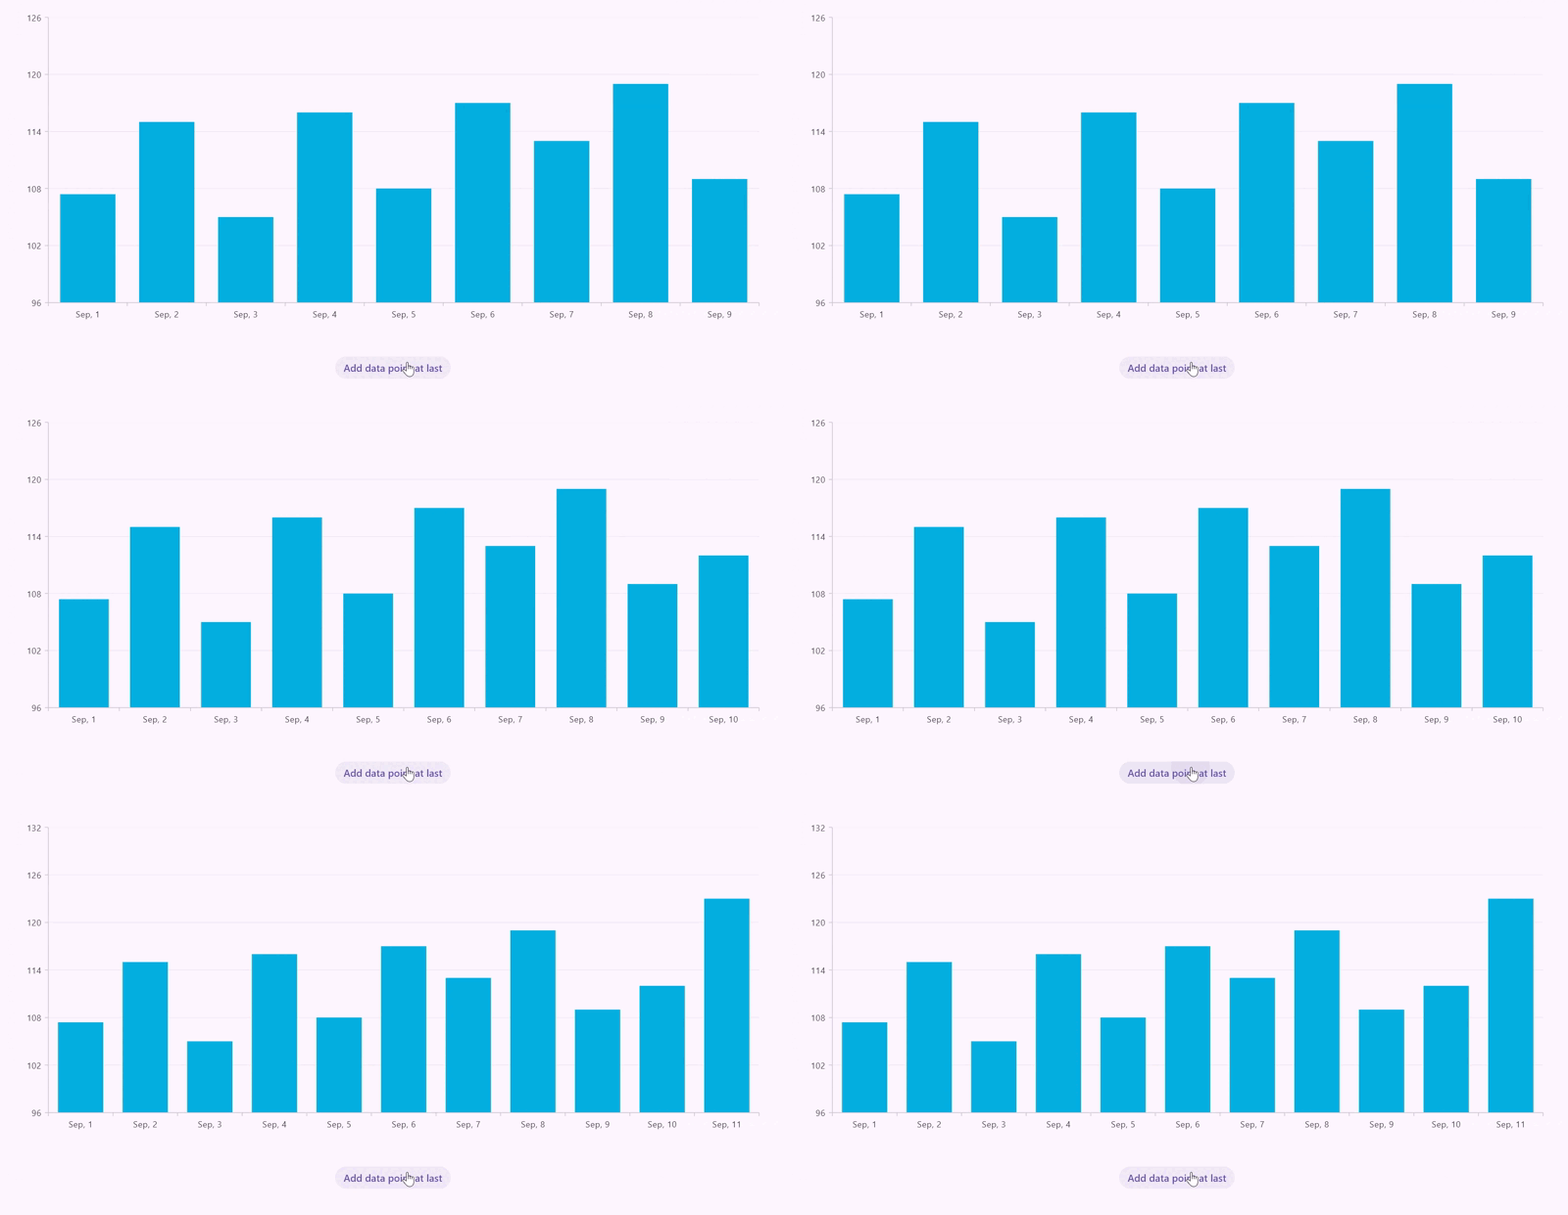
To add a new data point to the Supabase table, use the Supabase client instance to access the specific table by providing the table name. Then, call the insert() method and assign a new value to the required field.
In the following code example, we’ve added a duration of 1 day to the timestamp value of the last data point and assigned it to the date field. To assign a unique ID for each data point, we’ve incremented the existing data point length by 1 and assigned it to the id field in the table.
await _client. From('table_name').insert({
  'id': _chartData.length + 1,
  'date': _chartData.last.timestamp
      .add(const Duration(days: 1)),
  'yValue': 117,
});
Refer to the following image.
Update a data point
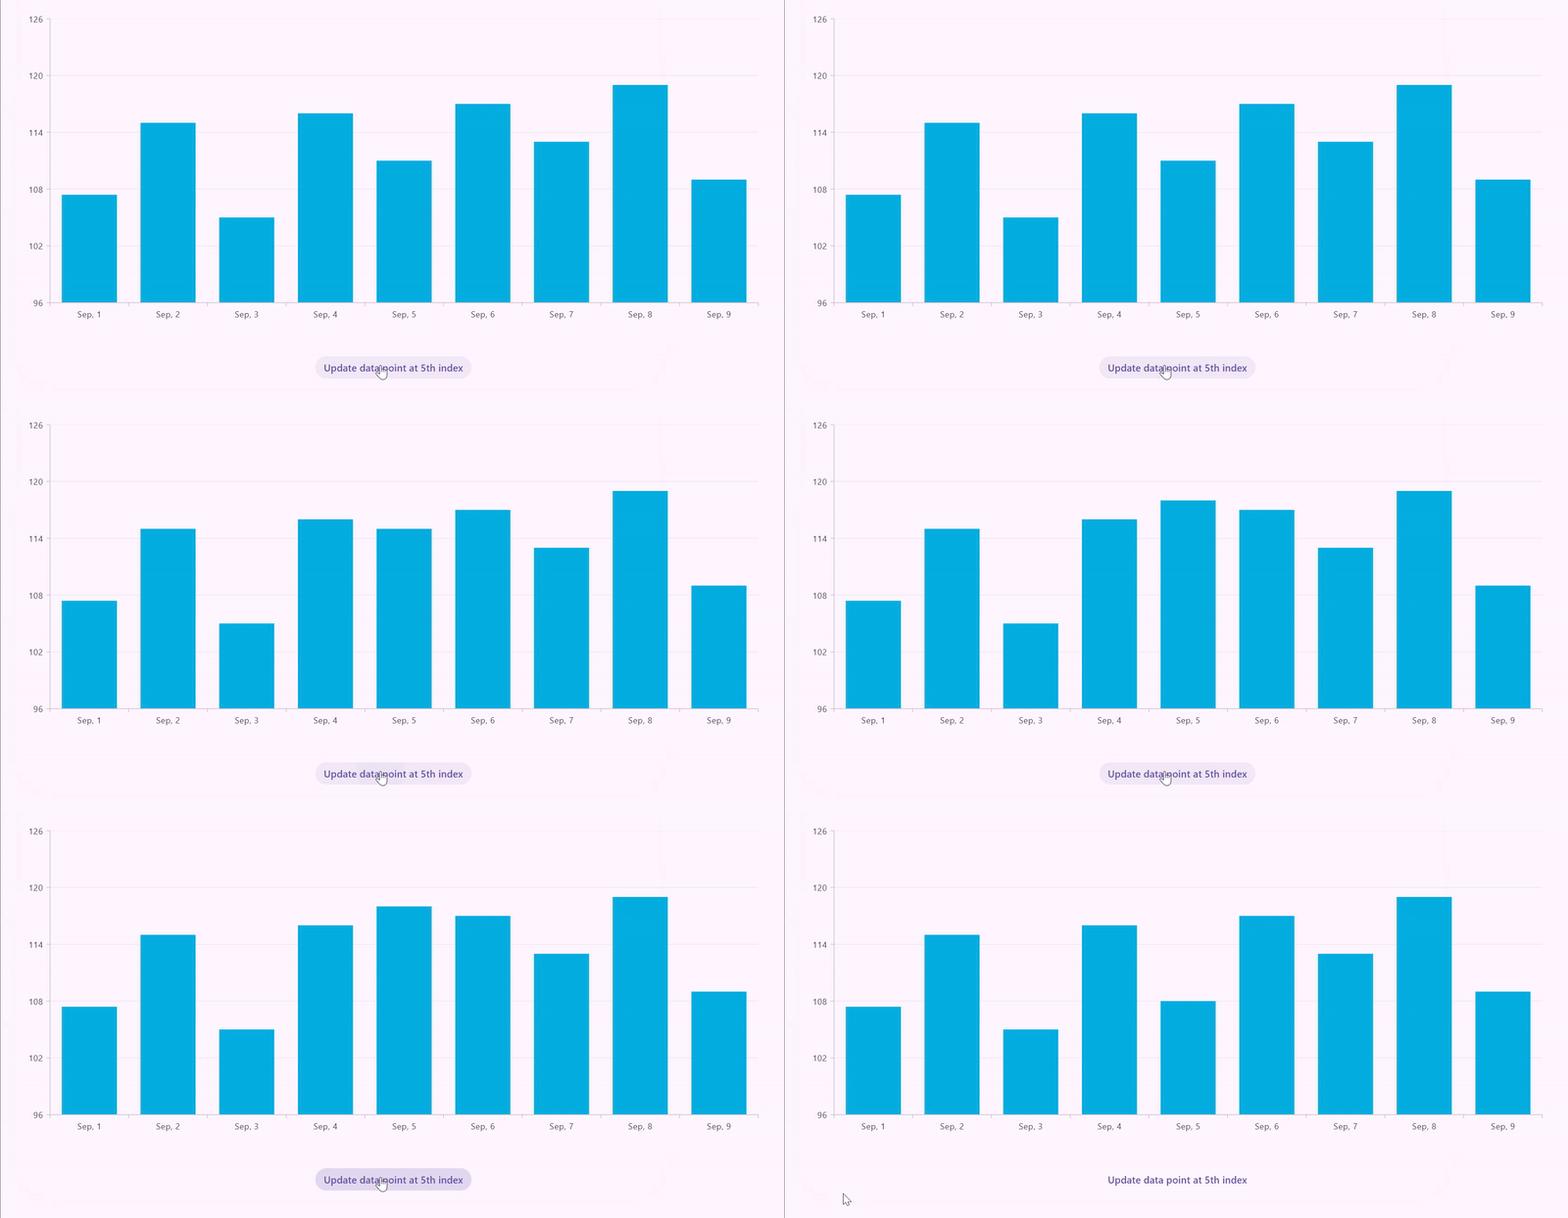
To modify a specific field in a data point, use the update() method. Then, pass the column name, and the new value needs to be updated. Then, use the eq() method to target the specific row in the table.
Here, we’ve updated the 5th column segment’s y-axis value in the chart.
await _client. From('table_name').update({
  'yValue': 110, // Previous value 105.
}).eq('id', 5);
Refer to the following image.
Delete a data point
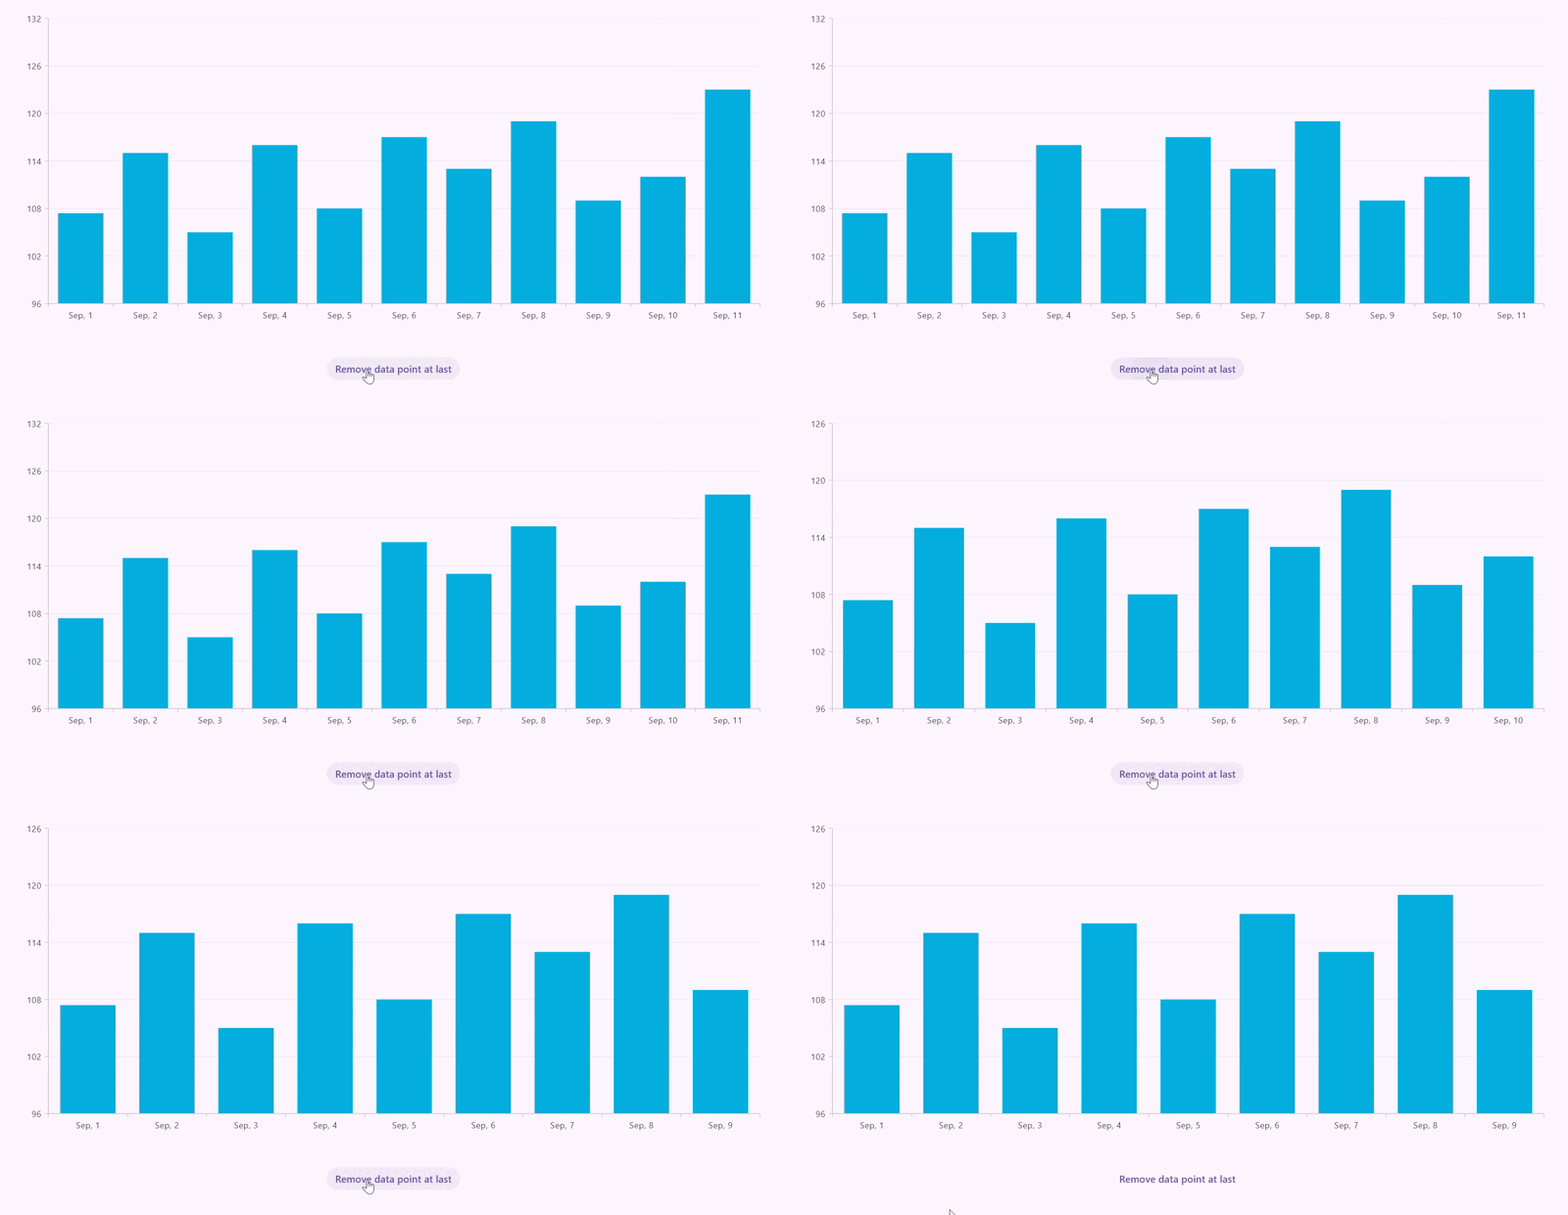
To delete a specific data point from the table, use the delete() method with the eq() method to specify the target row. The delete() method alone will delete all the rows in the table.
In the following code example, we’ve used the Supabase client and specified a table_name to identify the table. Then, we used the delete() method to remove a row from that table. The eq() method is used to specify the row to be deleted by comparing the id field in the table with the id of the last data point in the data source, ensuring that the last point is removed.
await _client
    .from('table_name')
    .delete()
    .eq('id', _chartData.last.id);
Refer to the following image.
GitHub reference
For more details, refer to the Integrating Flutter Charts with Supabase and performing CRUD actions GitHub demo.

Unlock the power of Syncfusion’s highly customizable Flutter widgets.
Conclusion
Thanks for reading! In this blog, we’ve seen how to integrate the Supabase database with the Syncfusion Flutter Charts widget and perform CRUD actions to manage data points efficiently. Try out the steps in this blog and leave your feedback in the comments section below!
For our customers, the latest version of Essential Studio® is available from the License and Downloads page. If you’re not a Syncfusion customer, try our 30-day free trial to evaluate our components.
If you have any questions, contact us through our support forum, support portal, or feedback portal. As always, we are here to assist you!

