In this blog, we will learn how to create and update a real-time chart in a Blazor server-side app using SignalR communication.
What is SignalR?
SignalR is an open-source software library used to send asynchronous notifications to client-side applications. The library includes both server-side and client-side components.
SignalR works great in any kind of web app, but the best use cases are generally apps that need dynamically changing real-time data to be presented in the UI.
We are going to create a real-time chart in a Blazor server-side app using the Syncfusion Blazor Charts component and SignalR.
Prerequisites
Create a Blazor server-side app
Follow these steps to create a Blazor server-side application:
- Open Visual Studio and select create a new project.
- Then, select the Blazor Server App template and click Next.
- Name the project BlazorSignalRChartApp and click Next. Ensure the target framework is .NET 6.0.
- Finally, select Create.
Thus, we have created the Blazor server-side app.
Setting up SignalR in the Blazor server project
Let’s configure the SignalR communication library with the Blazor server-side app.
Step 1: Add SignalR client library.
Add the SignalR client library to the Blazor server-side project:
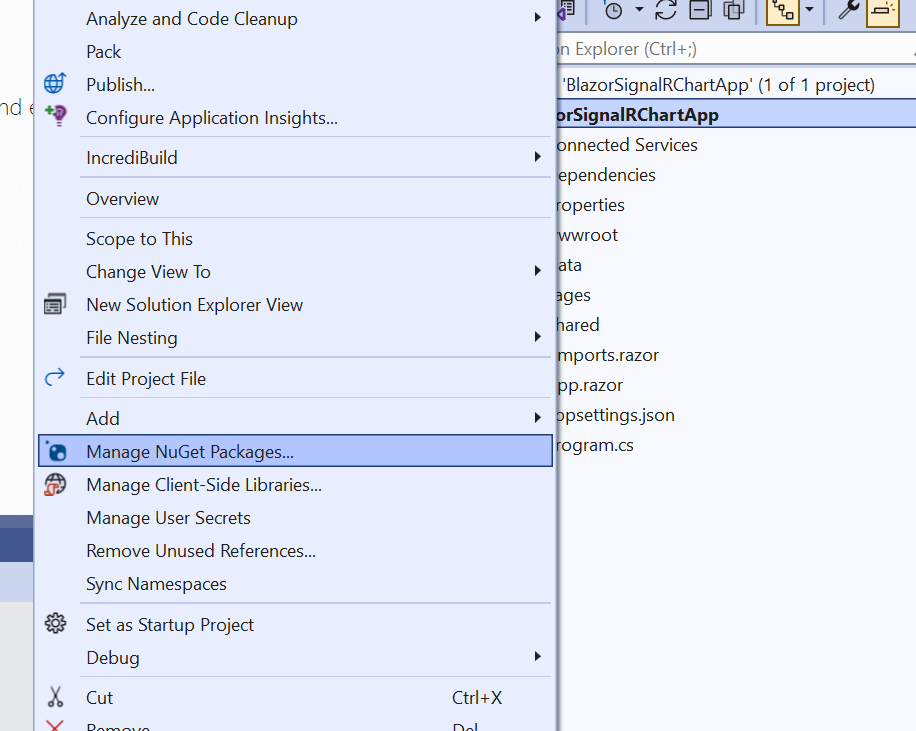
- In the Solution Explorer window, right-click the BlazorSignalRChartApp project and select Manage NuGet Packages.
- Now, confirm that the Package source is set to nuget.org.
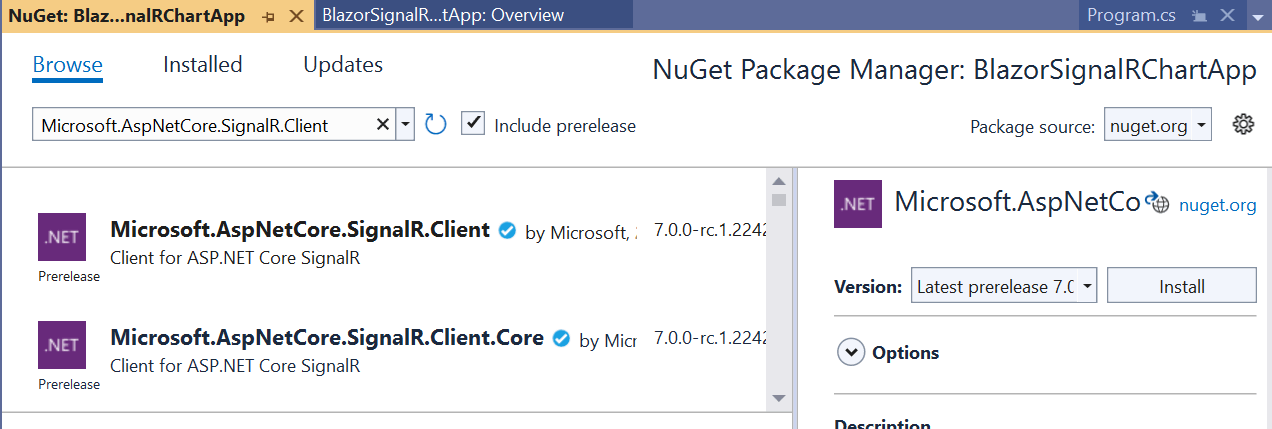
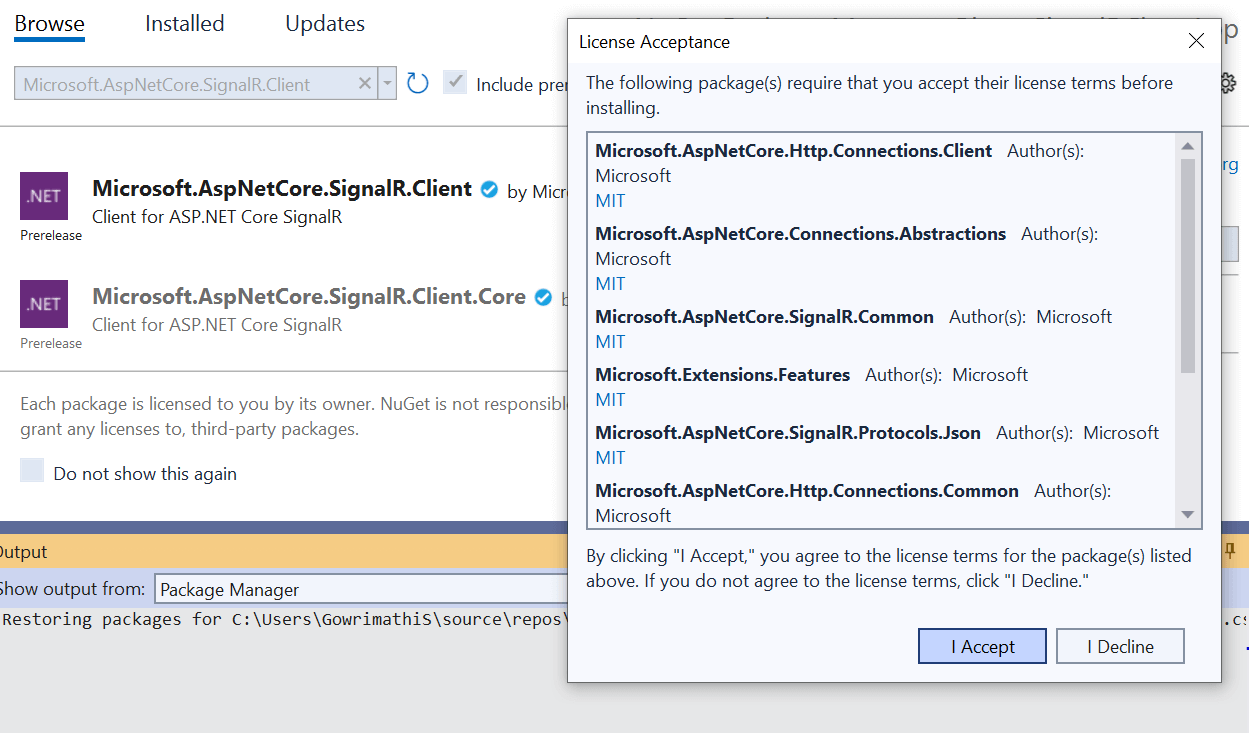
- Search for and select the Microsoft.AspNetCore.SignalR.Client package and then install it.
Step 2: Add SignalR hub to the project.
Let’s add the SignalR hub to the Blazor server-side project:
- In the Solution Explorer window, right-click the BlazorSignalRChartApp project and add a folder called Hubs. Then, add a class called ChartHub. The class should inherit from the SignalR’s Hub class, which is in the Microsoft.AspNetCore.SignalR namespace. Refer to the following code example.
using Microsoft.AspNetCore.SignalR; namespace BlazorSignalRChartApp.Server.Hubs { public class ChartHub : Hub { } } - Finally, to complete the configuration for the SignalR, add the endpoint for the hub in the Program.cs file like in the following code example.
using BlazorSignalRChartApp.Server.Hubs;
builder.Services.AddSignalR();
app.MapHub<ChartHub>("/charthub");
app.MapFallbackToPage("/_Host");
This code adds the SignalR to the request pipeline by pointing to the ChartHub class with the provided /charthub path.
Step 3: Add Syncfusion Blazor Charts to the project.
Next, we are going to use the Syncfusion Blazor Charts component to create a real-time chart. First, install the charts package:
- In the Solution Explorer window, right-click the BlazorSignalRChartApp project and select Manage NuGet Packages.
- Then, confirm that the Package source is set to nuget.org.
- Search for and select the Syncfusion.Blazor.Chart package and then install it.
- Open the ~/_Imports.razor file and import the Syncfusion.Blazor namespace in it.
@using Syncfusion.Blazor - Then, open the ~/Program.cs file and register the Syncfusion Blazor Service.
using BlazorSignalRChartApp.Server.Hubs; using Syncfusion.Blazor; var builder = WebApplication.CreateBuilder(args); // Add services to the container. builder.Services.AddSignalR(); builder.Services.AddSyncfusionBlazor();- Open the _Layout.cshtml file and add the following script reference in it.
<script src="https://cdn.syncfusion.com/blazor/syncfusion-blazor-base.min.js"></script> <script src="https://cdn.syncfusion.com/blazor/20.3.47/syncfusion-blazor.min.js"></script> - Add the Syncfusion Blazor Charts component in the Razor file. The Charts component is added in the ~/Pages/Index.razor file under the ~/Pages folder.
@using Syncfusion.Blazor.Charts <SfChart> </SfChart> - Press Ctrl+F5 (Windows) or ⌘+F5 (macOS) to run the application. Then, the Syncfusion Blazor Charts component will be rendered in the default web browser.
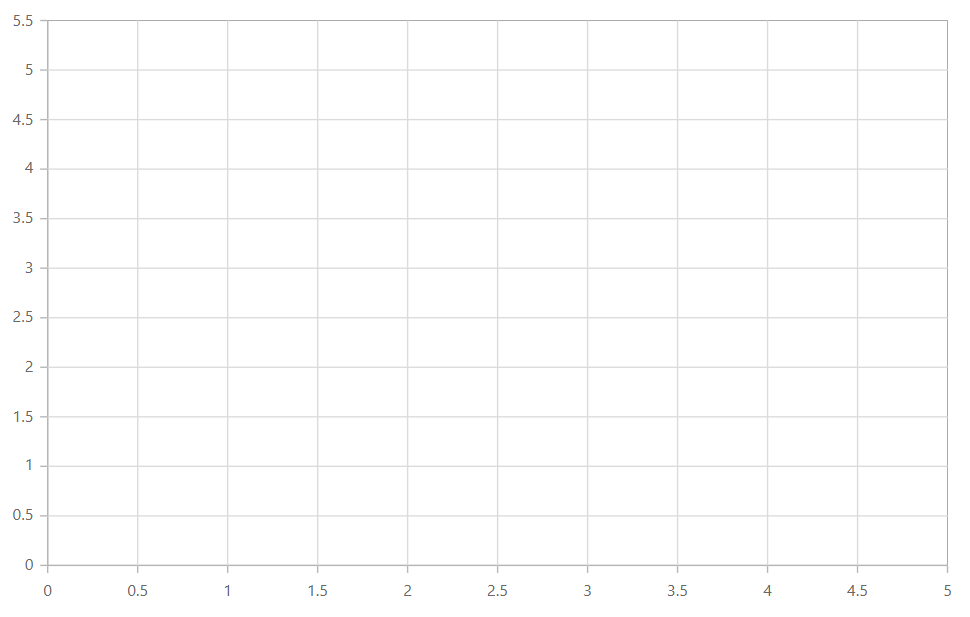
Adding Syncfusion Blazor Charts Component in the Server-Side App
- Open the _Layout.cshtml file and add the following script reference in it.
Step 4: Updating data to the chart through SignalR.
We have configured the SignalR server and added the Syncfusion Blazor Charts control in the client. Next, let’s see how to populate data to the chart through SignalR client:
- First, create a class named ChartData with Date and Value as properties inside the Data folder.
public class ChartData { Public DateTime Date { get; set; } public int Value { get; set; } } - Inside the ChartHub class, add the UpdateData() hub method to send the list of ChartData to the client when called. Refer to the following code.
public async Task UpdateData() { await Clients.All.SendAsync("ReceiveMessage", GetData()); } public static List<ChartData> GetData() { var r = new Random(); return new List<ChartData>() { new ChartData { Date = new DateTime(2022, 2, 2), Value = r.Next(1, 40) }, new ChartData { Date = new DateTime(2022, 3, 2), Value = r.Next(1, 40) }, new ChartData { Date = new DateTime(2022, 4, 2), Value = r.Next(1, 40) }, new ChartData { Date = new DateTime(2022, 5, 2), Value = r.Next(1, 40) } }; } - Next, create a connection to the hub (charthub) with the following code in the OnInitializedAsync method of the Index.razor file. Then, start the connection with the StartAsync method.
private HubConnection? hubConnection; protected override async Task OnInitializedAsync() { hubConnection = new HubConnectionBuilder() .WithUrl(NavigationManager.ToAbsoluteUri("/charthub")) .Build(); await hubConnection.StartAsync(); } - Once the connection is established, use SendAsync in the OnInitializedAsync method of the Index.razor file to call the hub method on the server with the specified method name. Refer to the following code example.
await hubConnection.SendAsync("UpdateData"); - Let’s replace the empty chart in the Index.razor file with a line chart. Refer to the following code example.
<SfChart Title="Stock Price Analysis of Product X"> <ChartArea><ChartAreaBorder Width="0"></ChartAreaBorder></ChartArea> <ChartPrimaryXAxis ValueType="Syncfusion.Blazor.Charts.ValueType.DateTime"> <ChartAxisMajorGridLines Width="0"></ChartAxisMajorGridLines> </ChartPrimaryXAxis> <ChartPrimaryYAxis Title="Price" Minimum="0" Maximum="40" Interval="4" LabelFormat="${value}"> <ChartAxisLineStyle Width="0"></ChartAxisLineStyle> <ChartAxisMajorTickLines Width="0"></ChartAxisMajorTickLines> </ChartPrimaryYAxis> <ChartTooltipSettings Enable="true"></ChartTooltipSettings> <ChartSeriesCollection> <ChartSeries Type="ChartSeriesType.Line"> </ChartSeries> </ChartSeriesCollection> </SfChart> - The chart currently renders without any data. Next, assign the data received by the client in the ReceiveMessage method to the chart, and map the XName and YName properties of the chart series to the corresponding data field names.
<ChartSeriesCollection> <ChartSeries DataSource="@Data" XName="Date" Width="2" YName="Value" Type="ChartSeriesType.Line"> </ChartSeries> </ChartSeriesCollection> @code { public List<ChartData> Data; hubConnection.On<List<ChartData>>("ReceiveMessage", (data) => { Data = data; InvokeAsync(StateHasChanged); }); } - Press Ctrl+F5(Windows) or ⌘+F5 (macOS) to run the application. Then, the Syncfusion Blazor Charts component with data from SignalR will be rendered in the default web browser.
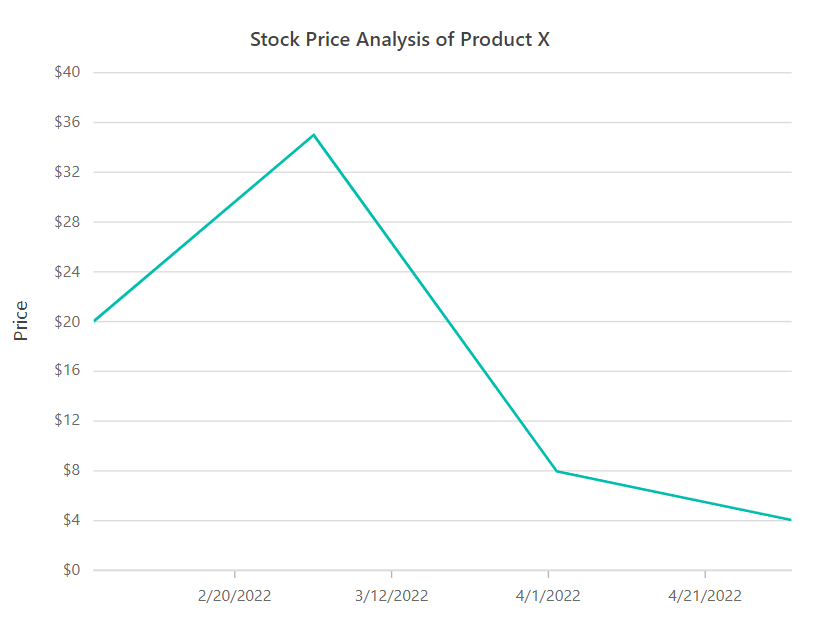
Updating Real-Time Chart Data Using SignalR in Blazor Server-Side App - Let’s create a timer that runs the AddData method to update the data in the chart through SignalR every two seconds. Now, every two seconds, the data from SignalR will be fed to the chart. Refer to the following GIF image.
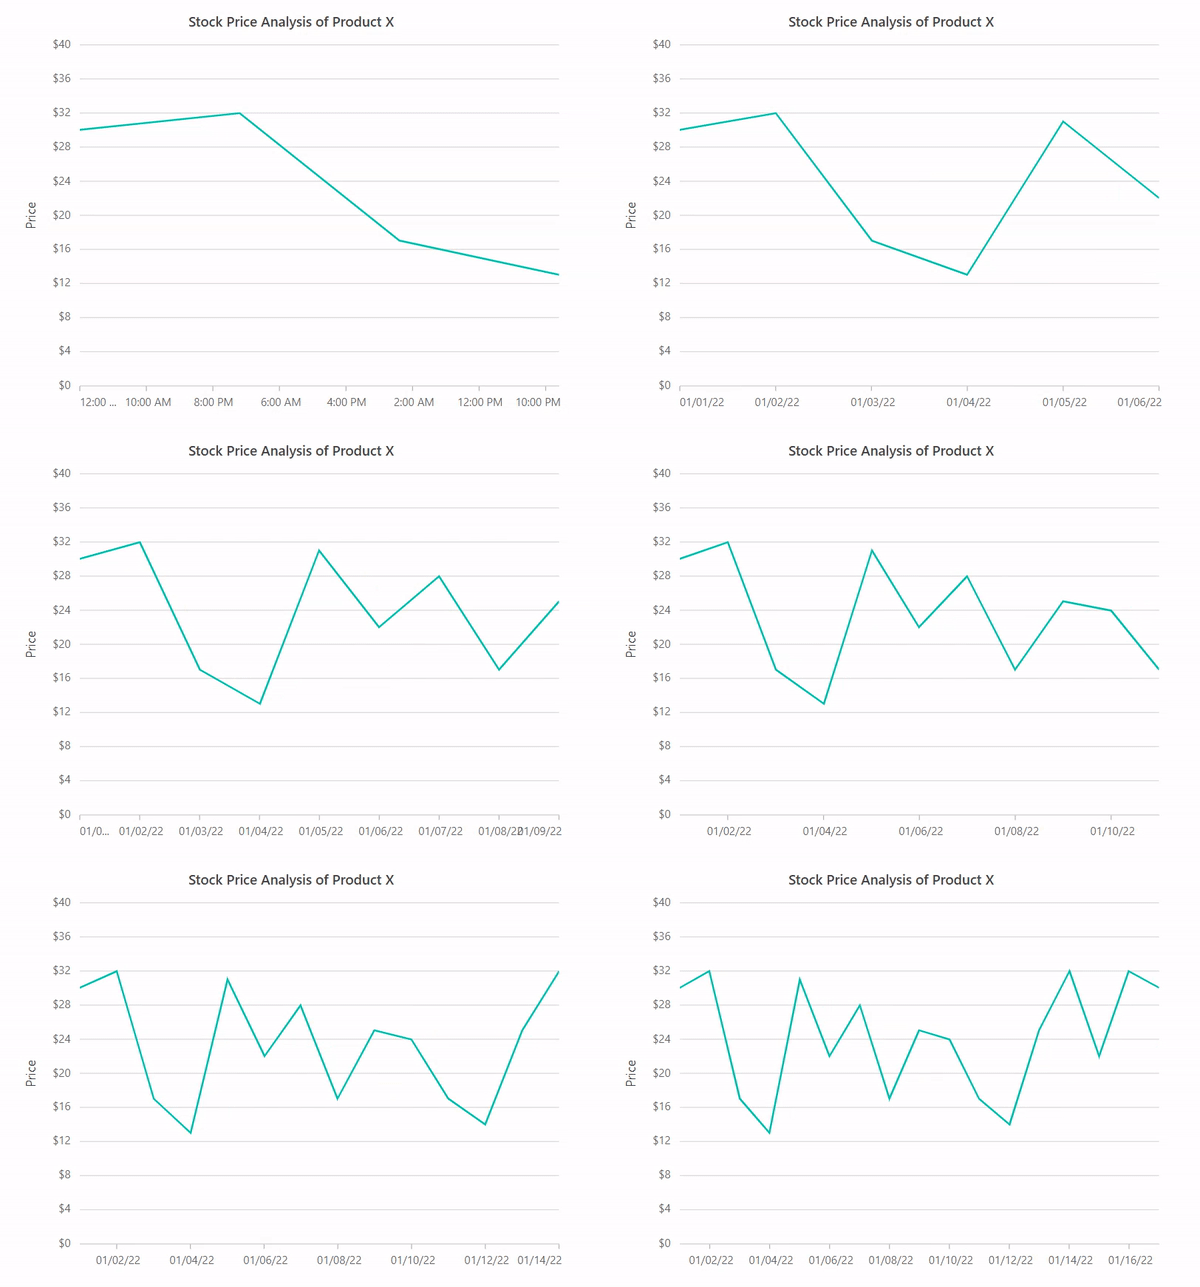
Updating Real-Time Chart Data Every Two Seconds Using SignalR in Blazor Server App
GitHub reference
For the complete example, check out the creating a real-time chart using SignalR in a Blazor server-side app demo on GitHub.

Syncfusion Blazor components can be transformed into stunning and efficient web apps.
Conclusion
Thanks for reading! In this blog, we’ve seen how to create and update a real-time chart in a Blazor server-side app using the Syncfusion Blazor Charts component and SignalR communication. Try out the steps in this blog and leave your valuable feedback in the comments section.
Essential Studio® for Blazor offers over 80+ UI components and file-format libraries. Use them to build world-class applications!
For questions, you can contact us through our support forums, support portal, or feedback portal. We are always happy to assist you!







Comments (2)
There is no explanation of where to put the code examples provided in step 5 and 6, and it looks like the example in step 6 replaces existing code? or is it supposed to be in addition to other code?
Also, the code in the github project is WILDLY different than the code outlined here. Very confusing.
Hi Lorna,
Once we establish the connection with the hub, we can call the hub methods using SendAsync, as mentioned in step 4. In step 5, we added a chart component. Step 6 explains how to retrieve the data on the client (this code comes after calling the hub method and does not replace the existing code) and assign it to the chart series. In the GitHub sample, in addition to the above-mentioned code, we included a timer to provide live updates for the chart.