In this post, we will walk you through configuring a data alert in the Syncfusion Dashboard Server. Often, you want to keep track of the data changes in your dashboard, and you also want to be notified whenever the data reaches a certain threshold value. We will show you how Syncfusion Dashboard Server helps you achieve this using data alerts. To watch the full video on this topic, visit our YouTube page.
In this example, I have a sales management dashboard in my dashboard server. We are going to add a data alert for the sales revenue.
Create schedule to start configuring the data alert.
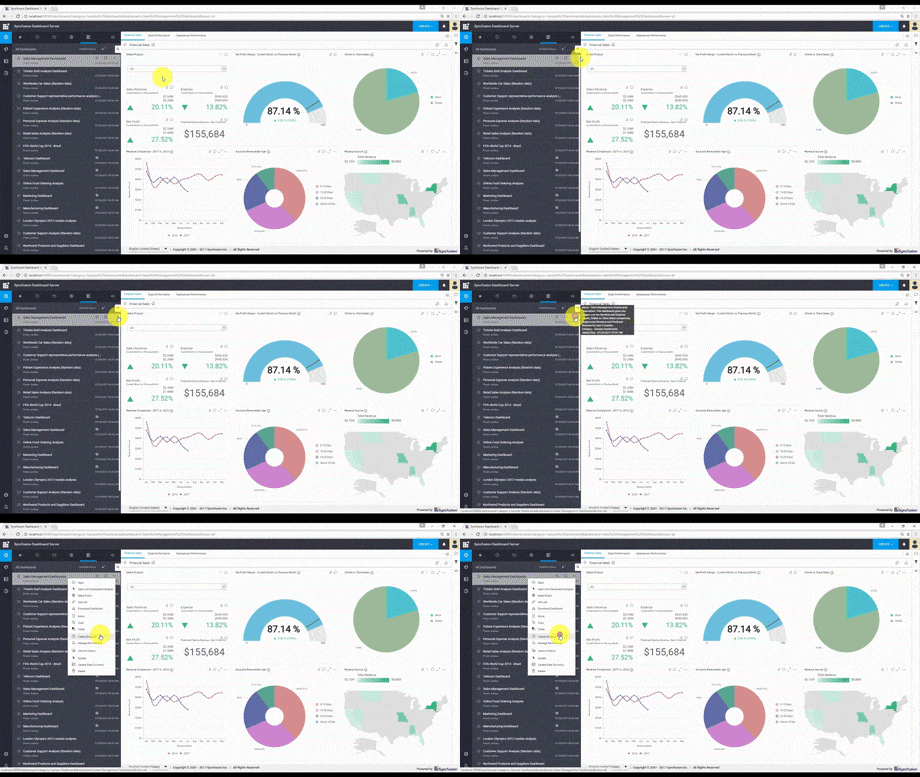
The data alert configuration dialog will pop up, where you can see the selected dashboard’s category and dashboard name. In case of a multi-tab dashboard, you can create alerts for individual tabs or for the entire dashboard itself in the Tabs drop-down. We are going to create alerts for sales revenue, so we’ll select the Financial Sales dashboard.
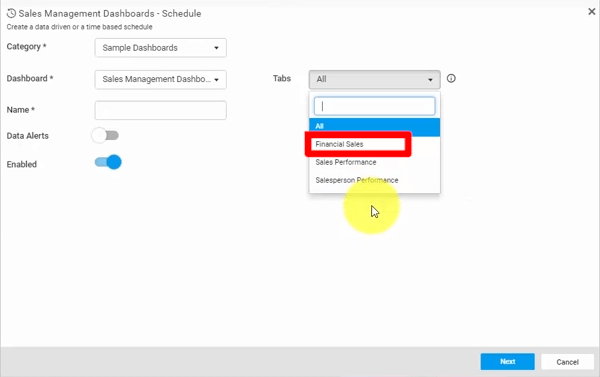
Selecting the Financial Sales Dashboard
We’ll add a name for our alert and enable the data alerts option. Then we click Next.
On the next pop-up, you need to choose the widget based on which filtering has to be done. For our requirement, we need to select Sales Revenue from the Choose Widget drop-down.
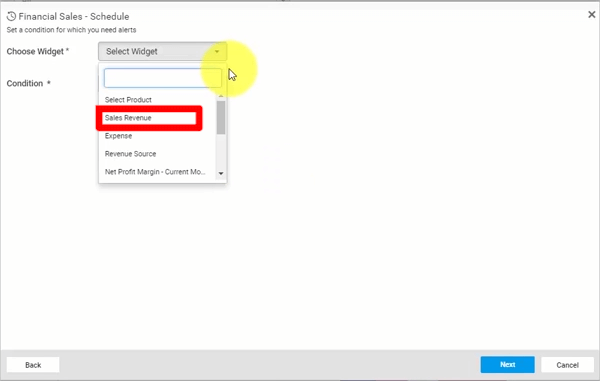
Selecting the Sales Revenue Widget
This enables the filter settings options at the bottom of the window. You can add alerts based on different conditions using the options in the Conditions drop-down:
- Value changes: checks whether the filtered value changes.
- Increases: checks whether the filtered value increases once.
- Continuously increases: checks whether the filtered value increases continuously.
- Decreases: checks whether the filtered value decreases once.
- Continuously decreases: checks whether the filtered value decreases continuously.
Since we need to add a filter based on a target value, we’ll select Value changes.
In the filter settings, you can choose the column to which you have to add an alert. We need to add an alert for the current month sales revenue in the first drop-down. And we need to check if the sales revenue is greater than $2 million, so we select the greater than symbol from the second drop-down. For the third drop-down, you can choose to provide custom input or a condition. We’ll choose the custom option, and provide the target value as 2 million in the text box that appears.
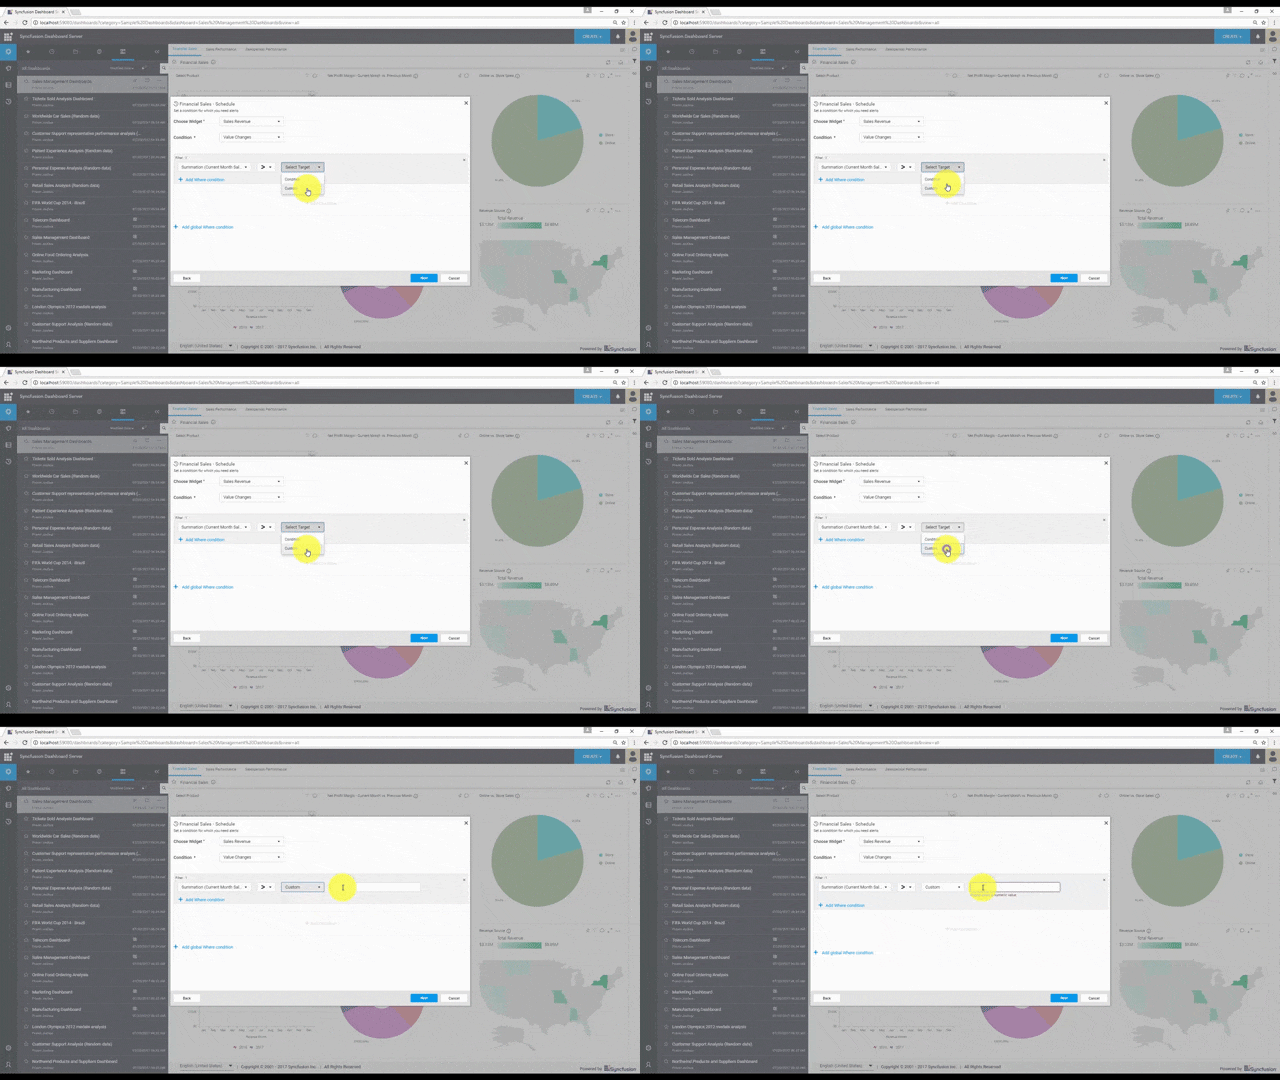
We can also add multiple value conditions for our filter. For this example, we need to check the sales revenue for a country. So we click Add Where condition, which you can see in the previous GIF, and then we choose the Country column and select the condition Include. In the third drop-down, we will choose a value from the database itself, so we select the Actual option, and then we select the value India.
Further, we need to add a condition for the sales type, so we click the +. The condition is AND. We change the column to SalesType and condition to Include, and Actual again for the target. We need to check the online sales, so Online is our value. Now, our filter configuration is completed.
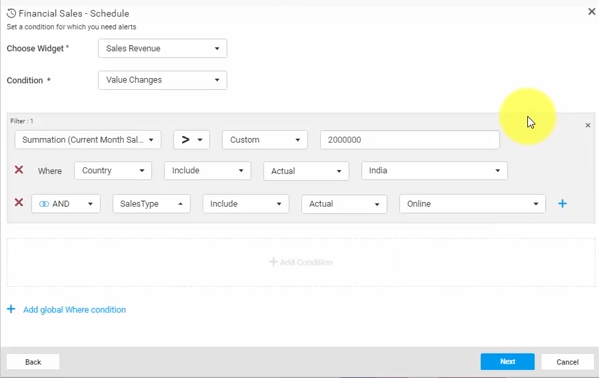
Completed Filter Configuration
You can add multiple filters to your alert by clicking +Add Condition below the filter box. Below that, you can see where you can also add a global Where condition. After completing your filter configuration, click Next to configure the email template.
Let’s see how to include your column in the email template. After choosing the Current Month Sales value from the drop-down, we click Insert.
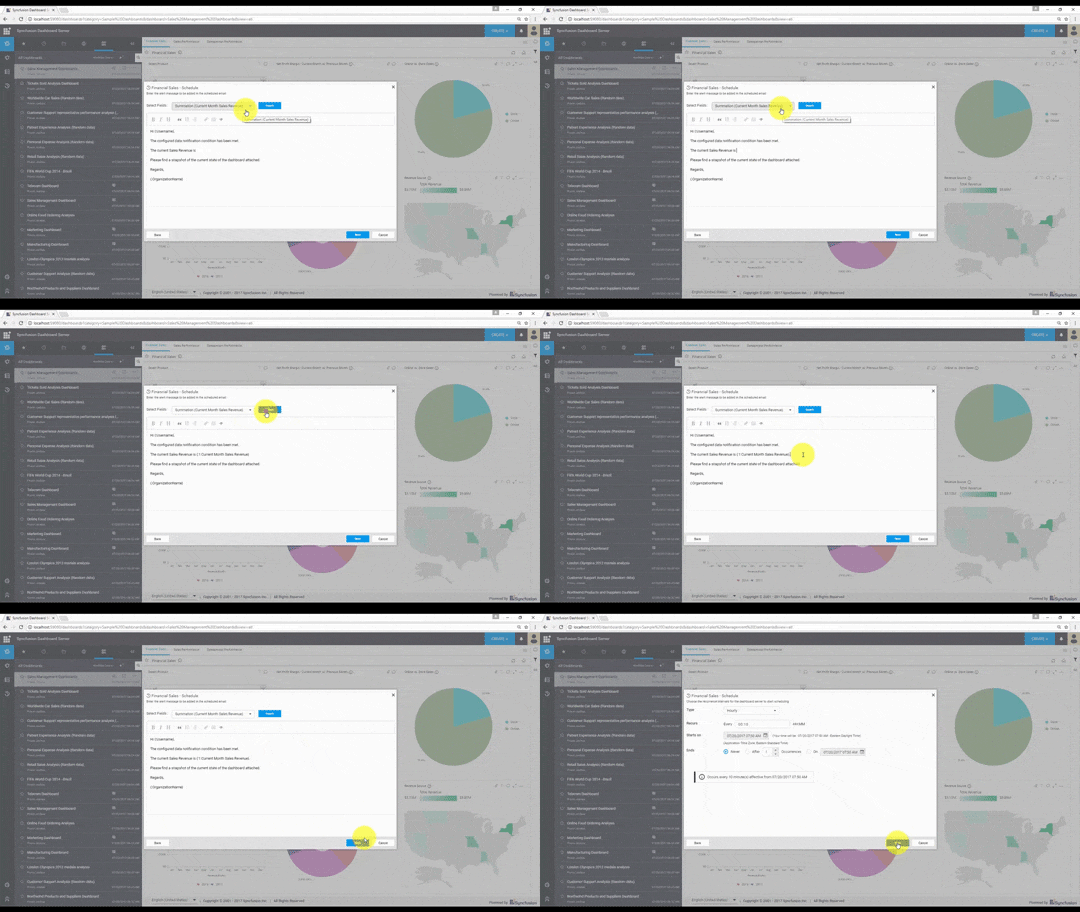
After configuring the email template, click Next to configure the schedule.
We want an hourly basis, and recursion every 10 minutes. When all the settings are properly modified, click Next.
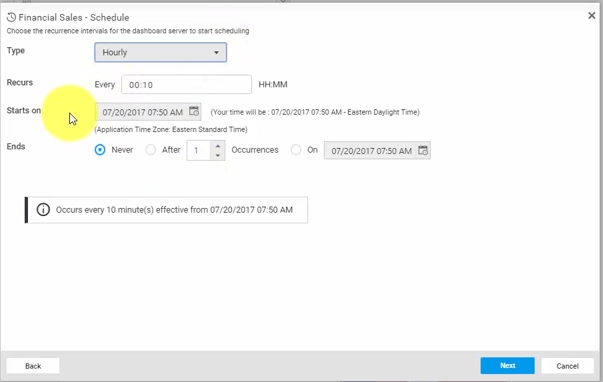
Configuring the Schedule
Here, you can add the email recipients for this alert. You can choose one of the Dashboard Server users from the first drop-down, select a group from the second, or even add an external recipient using the third box. In every email, the dashboard will be attached in an image, PDF, or Excel format. You can choose the format on the right side and click Schedule to complete the data alert configuration, as shown in the following image.
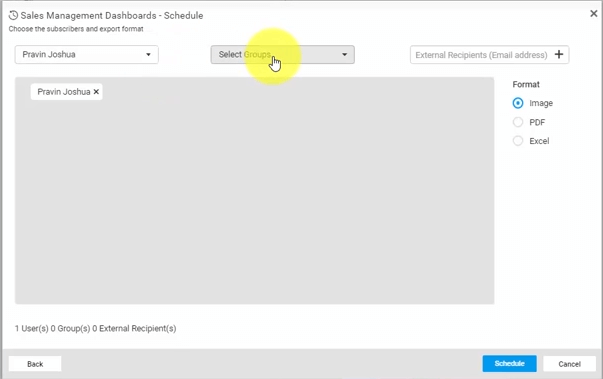
Adding Email Recipients
The data alert has now been successfully added.
In the dashboard server, we have a schedule icon on the left side. Clicking on it, you can see the alert that we added, and then you can go to the settings and choose to run, disable, edit, or delete the alert. We’ll click Run Now.
![]()
Selecting the Schedule Icon and Run Now
As you can see, we have received notification for the sales revenue alert that we configured.
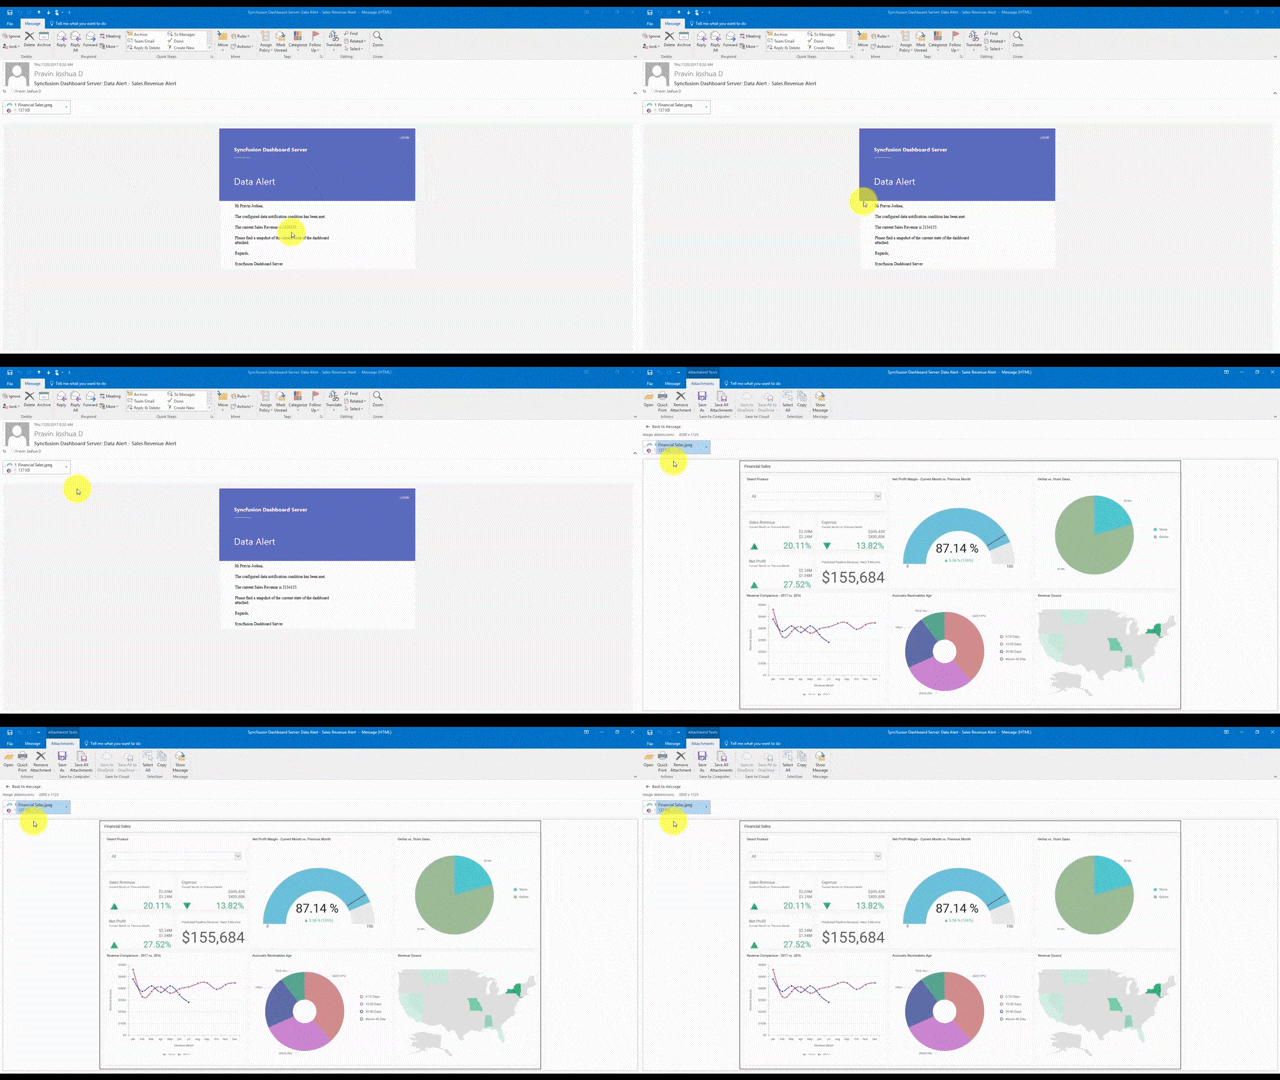
The sales revenue here has crossed the $2 million threshold, and also, there is an attachment of the dashboard in an image format.
We hope this walkthrough was helpful. Again, for the full video demonstration, please visit our YouTube page.
BI Solutions Using SSAS Tabular Model Succinctly
MongoDB 3 Succinctly
Hadoop Succinctly
Power BI Succinctly
R Programming Succinctly
