Blazor Charts control is a feature-rich component to visualize data. Its wide range of functionalities includes data binding, 30+ chart types, animation, tooltip, zooming and panning, crosshair, selection, and highlighting.
In this blog, we are going to discuss the performance improvements made in Blazor Charts for the 2021 Volume 3 release. These performance improvements make Syncfusion Blazor Charts the fastest in the world.
Faster dynamic updates in Blazor Charts
Previously, all elements in Blazor Charts were considered part of a single component and were created with a single builder in the RenderTreeBuilder method. Any single change to any chart element would re-render the entire component.
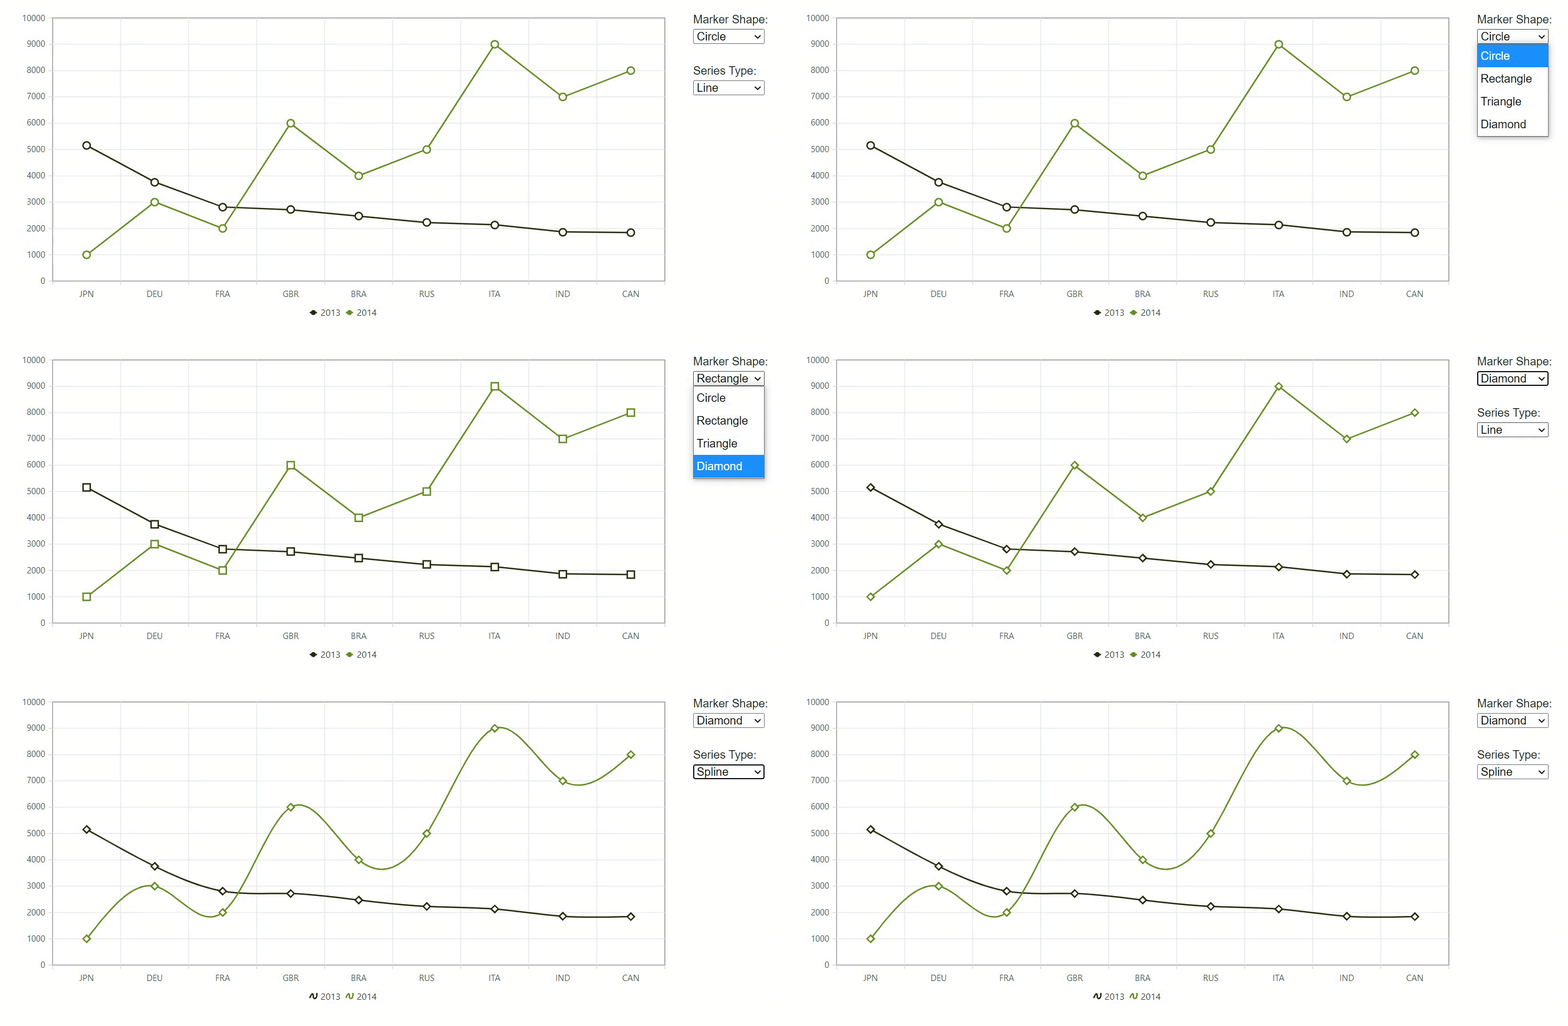
But now, all chart elements, like series, axes, legends, and data labels, are considered individual components and are rendered by overriding the RenderTreeBuilder method in their respective classes. This allows you to update any element in a chart exclusively, so you will experience faster updates in the Blazor Charts component.
<SfChart>
<ChartSeriesCollection>
         <ChartSeries>
         <ChartMarker Visible="true" Shape="@shape"></ChartMarker>
         </ChartSeries>
         <ChartSeries>
         <ChartMarker Visible="true" Shape="@shape"></ChartMarker>
         </ChartSeries>
 </ChartSeriesCollection>
 </SfChart>

@code{

ChartShape shape = ChartShape.Circle;

void ChangeMarker(ChangeEventArgs args)
    {
        shape = (ChartShape)Enum.Parse(typeof(ChartShape), (string)args.Value);
    }

}
Refer to the following GIF image. Here, the change in the marker shape doesn’t affect any other element in the chart.

Improved loading performance in Blazor Charts
With the modular architecture, we have drastically reduced Blazor Charts’ loading time and memory consumption. We built Charts to process a lot of data points, including several optimizations to handle them with a smooth user experience.
Refer to the following metrics for the Blazor line chart comparing the 2021 Volume 2 release to the 2021 Volume 3 release.
Server-side performance metrics
| No.of records | Improvements in Volume 3 as compared to Volume 2 (using .NET 5) |
| 10K | 2X |
| 50K | 3X |
| 100K | 3X |
| 1000K | 4X |
WebAssembly performance metrics
With the improved and optimized code, you can see a major difference in loading time for Blazor Charts in WASM applications in this 2021 Volume 3 release.
| No.of data points | Improvements in Volume 3 as compared to Volume 2 (using .NET 5) |
| 10K | 2X |
| 50K | 4X |
| 100K | 4X |
| 1000K | 5X |
Note: For more details, check out the live demo Example of Performance in the Blazor Charts Component.
Smooth zooming and panning in Blazor Charts
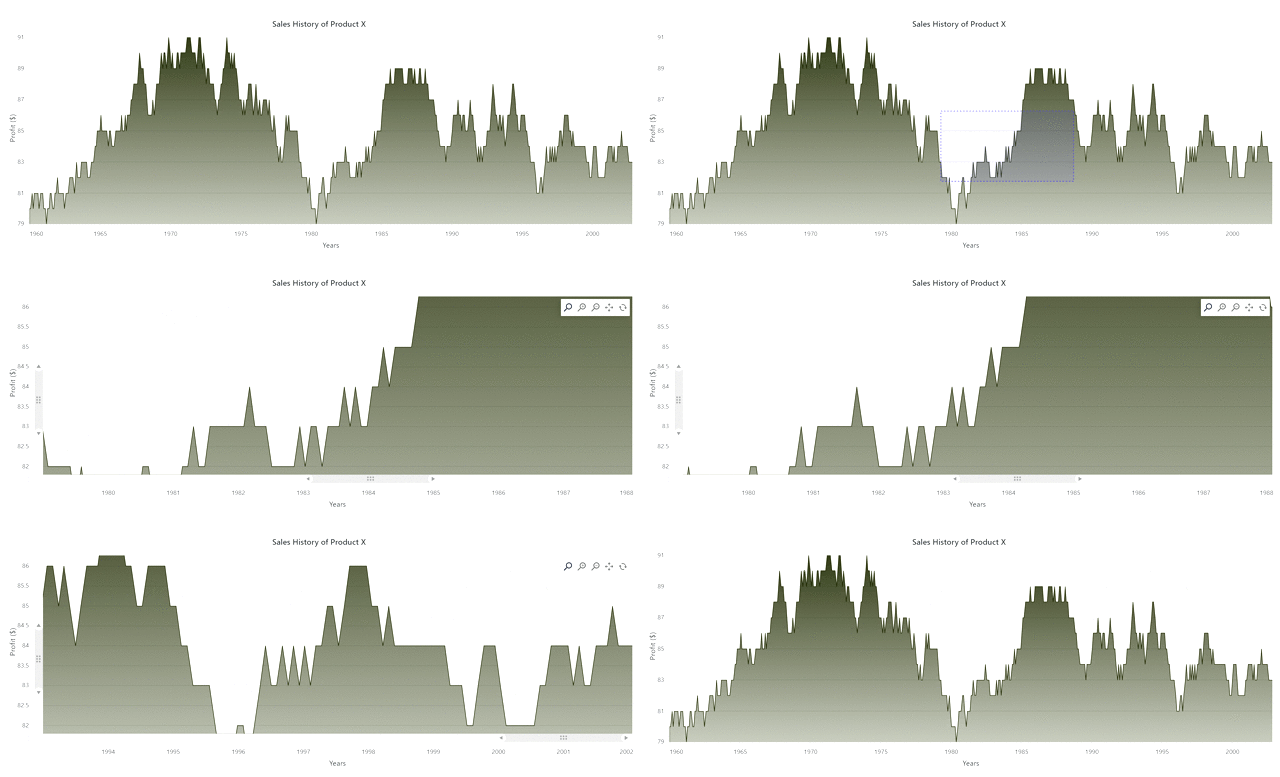
A good chart should provide smooth zooming and panning experience when dealing with a large volume of data. Now, you can see considerable improvements in zooming and the number of frames per second achieved when panning the Blazor Chart.
As we are changing the series and axis alone, the zooming and panning are smooth compared to the previous version.

Super-fast stock chart
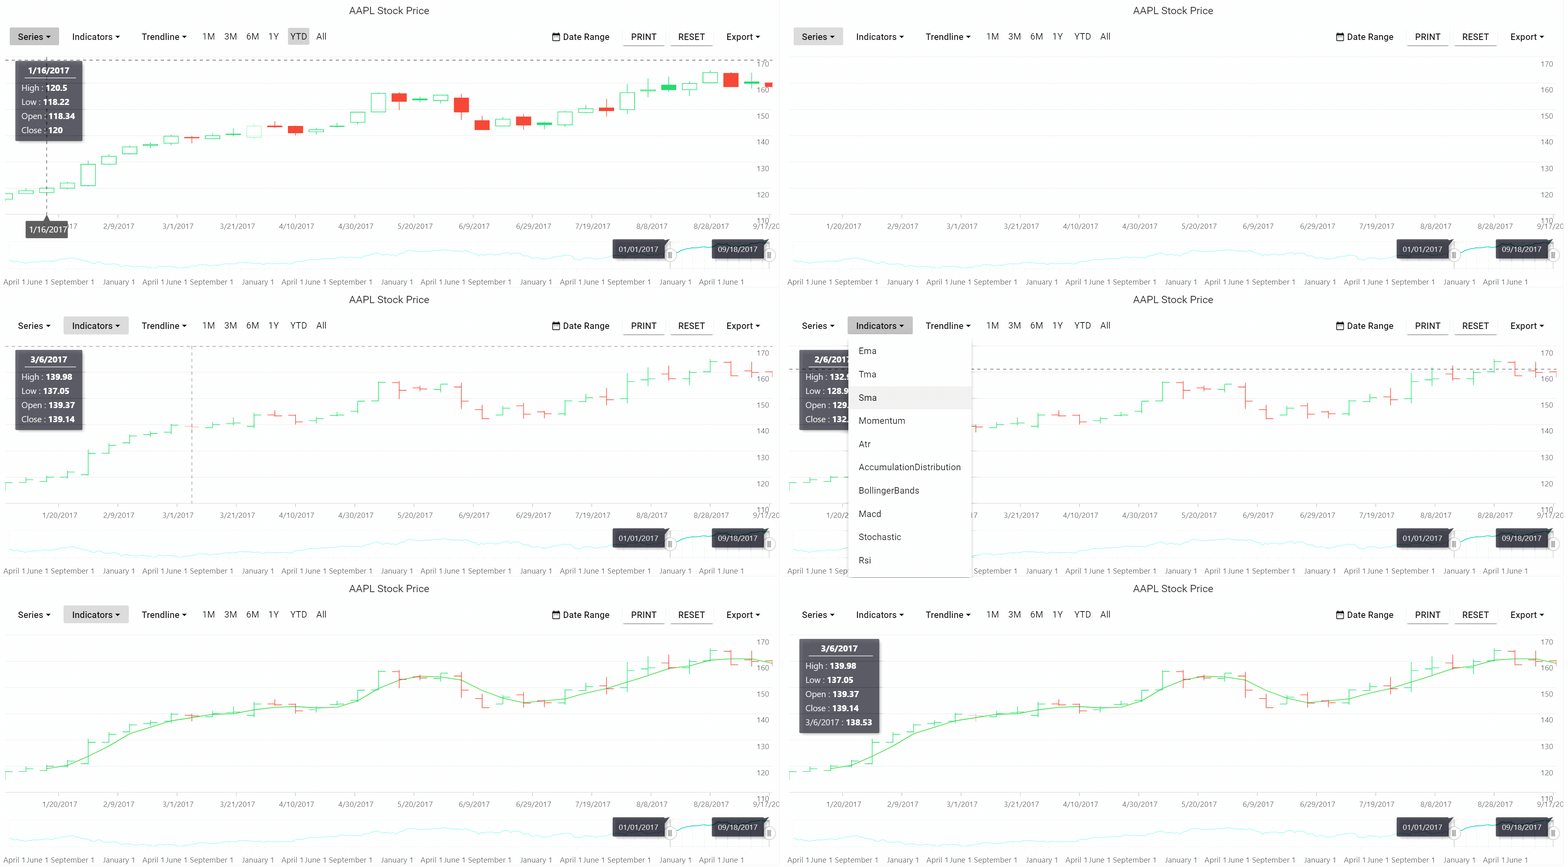
Previously, any change in a chart, like adding an indicator or trendline, would re-render the entire stock chart again. But now, a change to the stock chart doesn’t re-render the entire component. It just updates the required changes. This makes the stock chart update instant.

Performance tips
Even though we improved Blazor Charts’ performance at the source level, it is highly recommended to follow these tips on the app to fully utilize the improvement:
- Don’t use markers and data labels. Instead, use a tooltip or trackball to display data information.
- Avoid a category axis. Make use of numeric and date-time axes for large amounts of data.
- Use the line series for the fastest performance.
Conclusion
Thanks for reading! In this blog post, we have seen the various improvements made in Syncfusion Blazor Charts for the 2021 Volume 3 release. You can read more about the release in our Release Notes and What’s New pages. If you have any questions about the Blazor Charts component, please let us know in the comments section below.
For existing customers, the newest version of Essential Studio® is available for download from the License and Downloads page. If you are not yet a Syncfusion customer, you can try our 30-day free trial to check out our available features.
You can also contact us through our support forum, Direct-Trac, or feedback portal. We are always happy to assist you!


