
TL;DR: Let’s explore the differences between Stacked and Grouped Bar Charts. Stacked Bar Charts emphasize total values and sub-category contributions, while Grouped Bar Charts highlight comparisons between sub-categories. Both offer interactive features like tooltips and animations to enhance data visualization. Learn when to use each chart type to make informed decisions for your data representation.
Welcome to our Weekly Data Visualization blog series!
This blog will explore the differences between stacked and grouped bar charts and help you determine which best suits your needs.
Syncfusion Blazor suite provides powerful charting components that make implementing both stacked and grouped bar charts straightforward. With its robust charting capabilities, you can easily choose the right chart type based on your data.
Stacked Bar Charts
A Stacked Bar Chart visualizes data by stacking y-values over one another in the order of the series. It shows the relationship between individual values and the total sum of the data points. Each bar consists of multiple segments stacked horizontally on top of each other.
Using the Syncfusion Blazor Stacked Bar Chart, you can create visually appealing animated charts with interactive features such as tooltips, crosshairs, and data labels. These features help users quickly visualize and understand the data.
Key features and considerations of Blazor Stacked Bar Charts
The pros of stacked bar charts include their ability to clearly show the total value of all categories combined, making them ideal for visualizing overall totals. They are also space-efficient, as all sub-categories are contained within a single bar for each main category, and they effectively illustrate how individual sub-categories contribute to the overall total.
On the downside, stacked bar charts make it harder to compare values across sub-categories since only the bottom segment starts from a consistent baseline. Additionally, when adding many sub-categories, the chart can become cluttered and difficult to interpret.
Refer to the following code example. Here, we use the Blazor Stacked Bar Chart to illustrate how different categories of expenses contribute to total monthly spending. The ExpenseData class defines the properties for each expense category (Rent, Utilities, Groceries) and the month. To ensure accurate data visualization, we map each field from the data to the chart series XName and YName properties. The x-axis represents the month, while the y-axis shows the expenses in dollars.
XAML
@using Syncfusion.Blazor.Charts

<SfChart Width="70%" Height="400px" Title="Monthly Expenses by Category (Stacked)">
    <ChartPrimaryXAxis ValueType="Syncfusion.Blazor.Charts.ValueType.Category" Title="Month">
        <ChartAxisMajorGridLines Width="0"></ChartAxisMajorGridLines>
        <ChartAxisMajorTickLines Width="0"></ChartAxisMajorTickLines>
    </ChartPrimaryXAxis>
    <ChartPrimaryYAxis Title="Expenses (in dollars)" EdgeLabelPlacement="EdgeLabelPlacement.Hide">
         <ChartAxisLineStyle Width="0"></ChartAxisLineStyle>
         <ChartAxisMajorGridLines Width="0"></ChartAxisMajorGridLines>
         <ChartAxisMajorTickLines Width="0"></ChartAxisMajorTickLines>
    </ChartPrimaryYAxis>
    <ChartTooltipSettings Enable="true" Shared="true"></ChartTooltipSettings>
    <ChartSeriesCollection>
        <ChartSeries DataSource="@Data" XName="Month" YName="Rent" Name="Rent" Type="ChartSeriesType.StackingBar" Fill="#933895" />
        <ChartSeries DataSource="@Data" XName="Month" YName="Utilities" Name="Utilities" Type="ChartSeriesType.StackingBar" Fill="#8BC34A" />
        <ChartSeries DataSource="@Data" XName="Month" YName="Groceries" Name="Groceries" Type="ChartSeriesType.StackingBar" Fill="#1e92c8" />
    </ChartSeriesCollection>
</SfChart>
C#
@code {
    private List<ExpenseData> Data = new List<ExpenseData>
    {
        new ExpenseData { Month = "Jan", Rent = 800, Utilities = 150, Groceries = 300 },
        new ExpenseData { Month = "Feb", Rent = 800, Utilities = 130, Groceries = 320 },
        new ExpenseData { Month = "Mar", Rent = 800, Utilities = 160, Groceries = 280 },
        new ExpenseData { Month = "Apr", Rent = 800, Utilities = 140, Groceries = 310 },
        new ExpenseData { Month = "May", Rent = 800, Utilities = 170, Groceries = 290 },
    };

    public class ExpenseData
    {
        public string Month { get; set; }
        public double Rent { get; set; }
        public double Utilities { get; set; }
        public double Groceries { get; set; }
    }
}
Refer to the following image.
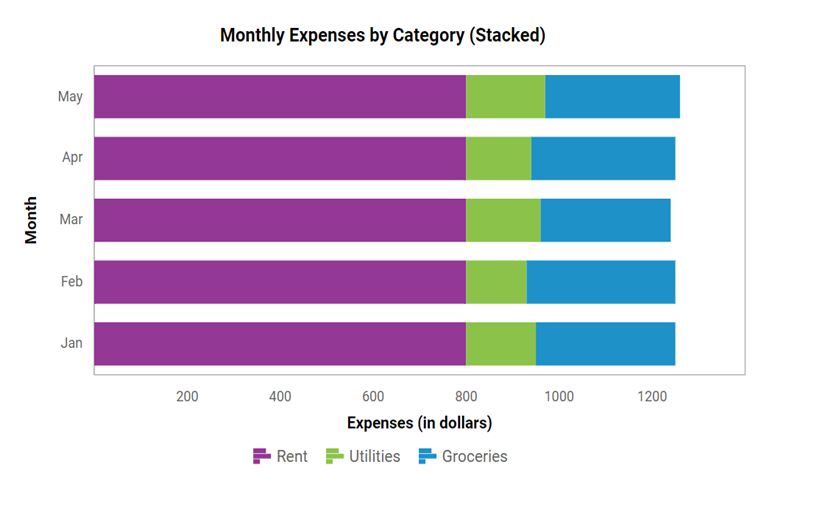
Using the above Blazor Stacked Bar Chart example, you’ll gain insights into how different categories of expenses contribute to total monthly spending. This visualization allows you to see the proportion of each expense category within the total, helping to identify major cost drivers.
You can also quickly view and compare overall expenses across different months, making it easier to track spending fluctuations.
Grouped Bar Charts
A grouped bar chart (Clustered bar chart) organizes data into groups, allowing for easy comparison across sub-categories within each main category. Instead of stacking values, as in a stacked bar chart, a grouped bar chart displays each sub-category as an individual bar next to others in the same group, making it simple to visually compare values across multiple sub-categories within the same main category.
In the Syncfusion Blazor Grouped Bar Chart, you can create visually appealing animated charts with interactive features such as tooltips, crosshairs, and data labels, which help users quickly visualize and understand the data.
Key features and considerations of Blazor Grouped Bar Charts
Grouped bar charts make it easy to compare multiple sub-categories within each main category, helping to identify trends and differences in values. Since each sub-category is represented by its bar, they provide detailed and precise data presentation.
However, grouped bar charts can become cluttered and difficult to read when there are too many sub-categories or groups, making quick interpretation challenging. They also require more space than stacked bar charts, as each sub-category is displayed separately. Additionally, grouped bar charts emphasize differences between sub-categories rather than the overall total within each group.
Refer to the following code example. Here, we use the Blazor Grouped Bar Chart to compare energy consumption across three sectors (Residential, Commercial, and Industrial) over several quarters. This type of visualization is helpful for energy providers or analysts looking to track and compare sector-specific energy use trends over time. To ensure accurate data visualization, we map each field from the data to the chart series XName and YName properties. The x-axis represents quarters, while the y-axis displays energy consumption in gigawatt hours (GWh), allowing for a straightforward comparison.
XAML
@using Syncfusion.Blazor.Charts

<SfChart Width="70%" Height="400px" Title="Quarterly Energy Consumption by Sector">
    <ChartPrimaryXAxis ValueType="Syncfusion.Blazor.Charts.ValueType.Category" Title="Quarter">
        <ChartAxisMajorGridLines Width="0"></ChartAxisMajorGridLines>
        <ChartAxisMajorTickLines Width="0"></ChartAxisMajorTickLines>
    </ChartPrimaryXAxis>
    <ChartPrimaryYAxis Title="Energy Consumption (in GWh)" EdgeLabelPlacement="EdgeLabelPlacement.Hide">
        <ChartAxisLineStyle Width="0"></ChartAxisLineStyle>
        <ChartAxisMajorGridLines Width="0"></ChartAxisMajorGridLines>
        <ChartAxisMajorTickLines Width="0"></ChartAxisMajorTickLines>
    </ChartPrimaryYAxis>
    <ChartTooltipSettings Enable="true" Shared="true"></ChartTooltipSettings>
    <ChartSeriesCollection>
        <ChartSeries DataSource="@Data" XName="Quarter" YName="Residential" Name="Residential" Type="ChartSeriesType.Bar" Fill="#0076E5" />
        <ChartSeries DataSource="@Data" XName="Quarter" YName="Commercial" Name="Commercial" Type="ChartSeriesType.Bar" Fill="#CB3587" />
        <ChartSeries DataSource="@Data" XName="Quarter" YName="Industrial" Name="Industrial" Type="ChartSeriesType.Bar" Fill="#09AF74" />
    </ChartSeriesCollection>
</SfChart>
C#
@code {
    private List<EnergyData> Data = new List<EnergyData>
    {
        new EnergyData { Quarter = "Q1", Residential = 220, Commercial = 300, Industrial = 400 },
        new EnergyData { Quarter = "Q2", Residential = 210, Commercial = 320, Industrial = 380 },
        new EnergyData { Quarter = "Q3", Residential = 230, Commercial = 310, Industrial = 390 },
        new EnergyData { Quarter = "Q4", Residential = 240, Commercial = 330, Industrial = 410 },
    };

    public class EnergyData
    {
        public string Quarter { get; set; }
        public double Residential { get; set; }
        public double Commercial { get; set; }
        public double Industrial { get; set; }
    }
}
Refer to the following image.
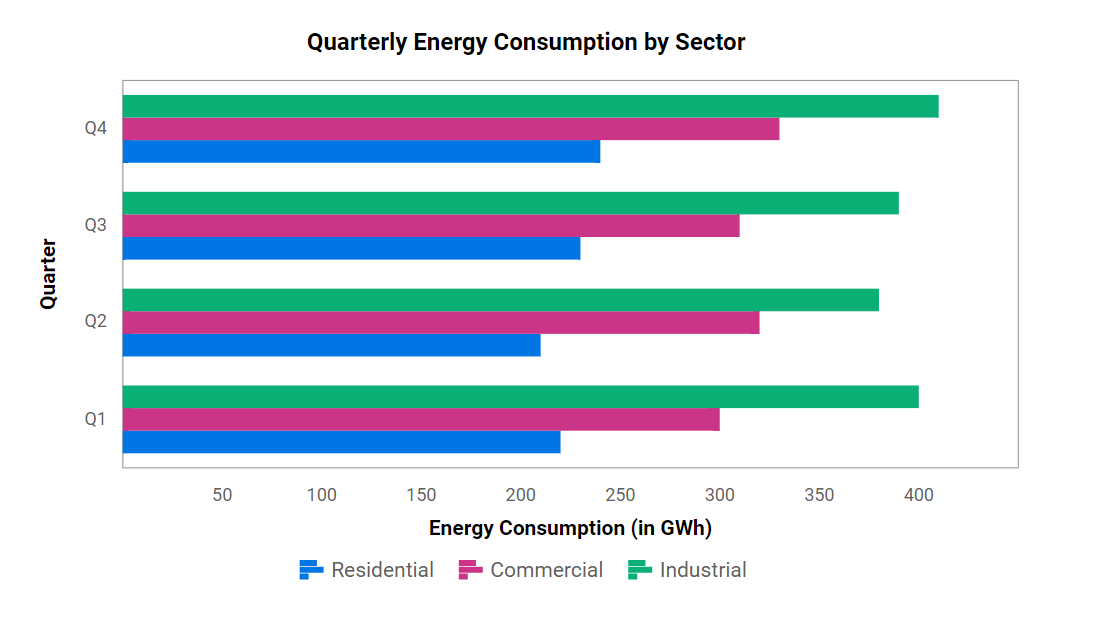
The above Blazor Grouped Bar Chart example enables easy analysis of each department’s revenue trends across quarters, making it ideal for spotting seasonal patterns and identifying strong or weak quarters by department. This visualization provides a clear breakdown of revenue, allowing for straightforward comparisons between departments in each quarter and highlighting trends that support strategic planning and decision-making.
Comparison
Let’s summarize the difference between stacked and grouped bar charts.
|
Aspect |
Stacked Bar |
Grouped Bar |
|
Purpose |
Visualize the total and the contribution of sub-categories to that total. |
Compare values across sub-categories within each main category. |
|
Ease of comparison |
Harder to compare individual sub-categories as only the bottom segment has a consistent baseline. |
Easier to compare sub-categories as each is represented with its own bar starting from the same baseline. |
|
Space efficiency |
Space-efficient as sub-categories are combined within a single bar. |
Requires more space since each sub-category has its own bar. |
|
Focus |
Highlights the total value of a main category and the proportional contribution of sub-categories. |
Highlights differences and trends across sub-categories within each main category. |
|
Best use case |
Summarizing how sub-categories contribute to the total (e.g., total monthly expenses by category). |
Comparing sub-category values within each category (e.g., energy consumption by sector and quarter). |
References
For more details, refer to the Blazor Stacked Bar Chart and Grouped Bar Chart demos.

Conclusion
Thanks for reading! In this blog, we’ve explored the features and differences between the Stacked Bar and Grouped Bar Charts using the Syncfusion Blazor Charts and how to choose the right chart type for your data needs. Try them out and leave your feedback in the comments section below!
Explore our Blazor Charts examples to learn more about the supported chart types and how easy it is to configure them for stunning visual effects.
The latest version of the Blazor Charts component is available for current customers from the License and Downloads page. If you are not a Syncfusion customer, try our 30-day free trial to see it yourself.
You can also contact us through our support forums, support portal, or feedback portal. We are always happy to assist you!


 No spam, just valuable updates.