TL;DR: Learn to add scrollbars to Syncfusion Flutter Charts using the Range Slider and Range Selector widgets. This guide provides step-by-step instructions and code examples to enhance chart navigation. Perfect for seamless zooming and panning. Check it out!
Syncfusion Flutter Charts contains a rich gallery of 30+ charts and graphs, ranging from line to financial charts, that cater to all charting scenarios.
In this blog, we will explore how to add a scrollbar in Flutter Charts to track the zoom and pan progress and its limits. The scrollbar feature is not built into our Flutter Charts; however, we can add it using the SfRangeSlider and SfRangeSelector widgets.
Let’s walk through the steps to achieve the same.
Adding a mini-map scrollbar
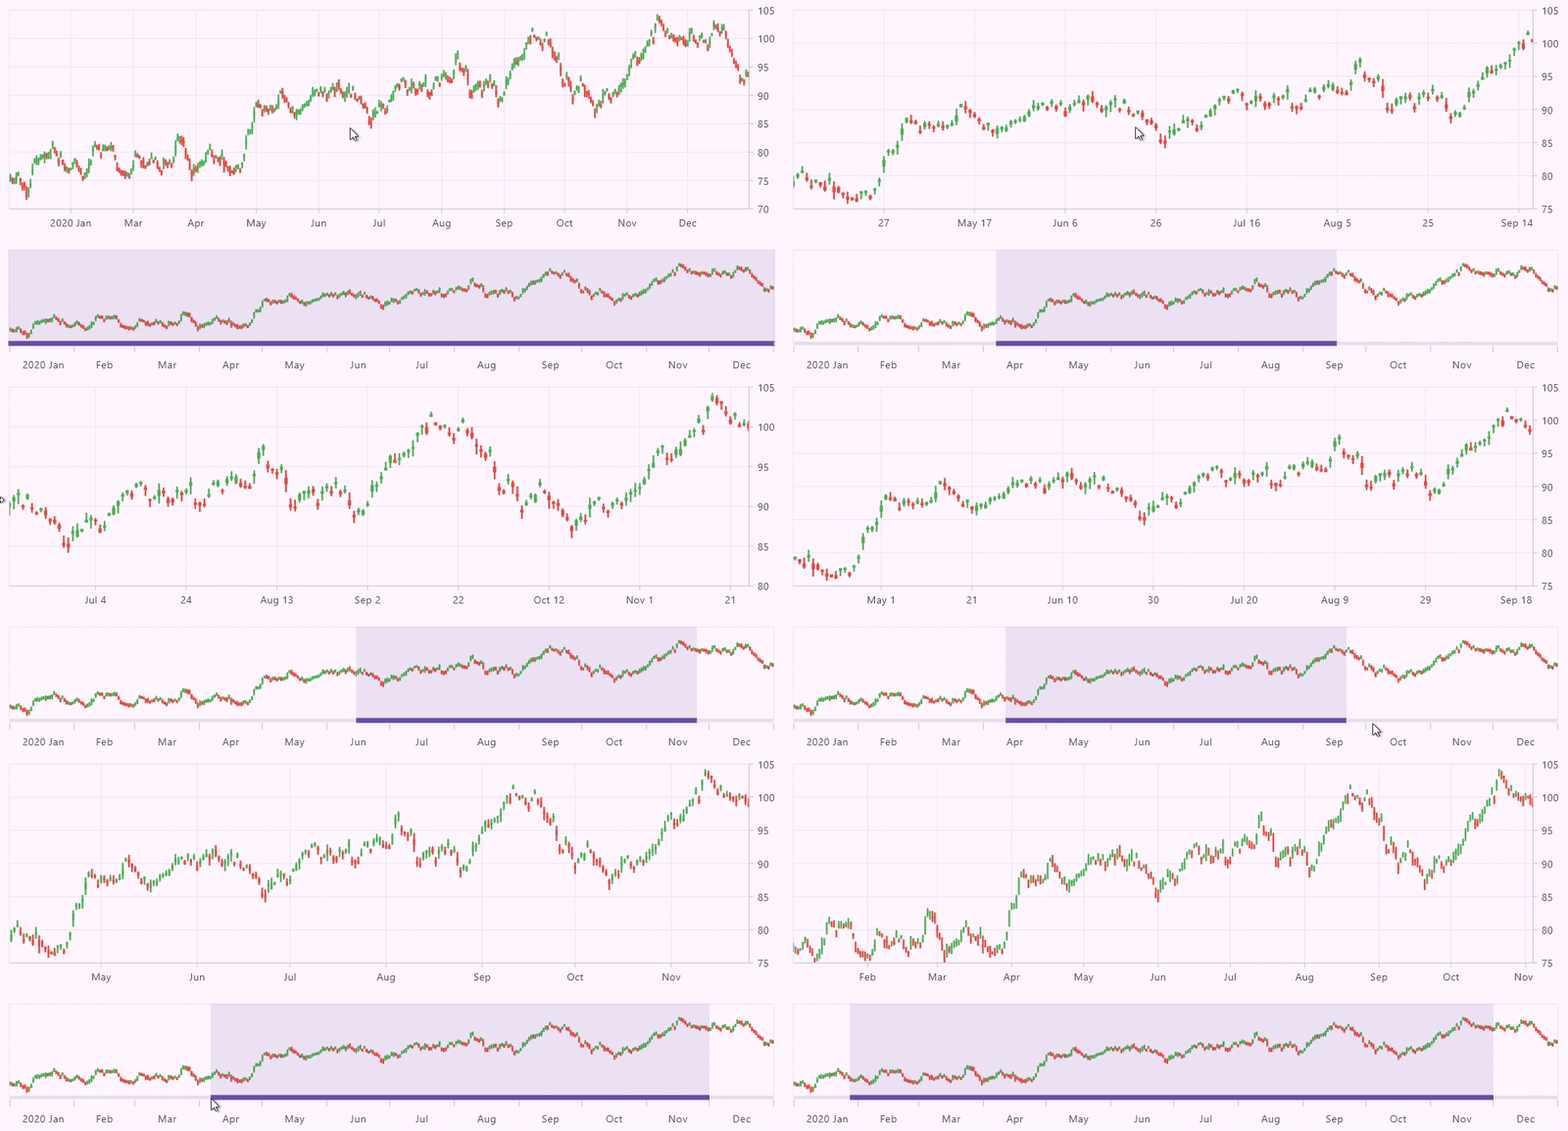
The SfRangeSelector widget is used to select a range of values between the set minimum and maximum values, and it can accept any widget as its child. One unique feature of the SfRangeSelector is its ability to map the range selection in SfCartesianChart, making it function as a mini-map scrollbar. This is achieved through the use of the RangeController.
The SfRangeSelector has a controller property of type RangeController, which updates whenever the range of the SfRangeSelector changes through interaction. On the other hand, the SfCartesianChart supports a built-in option to listen to and update the RangeController through the rangeController property of the Numeric and DateTime axes. Whenever the range of the CartesianSeries changes due to zooming, panning, or direct range-related APIs, the RangeController is updated internally in the Charts, similar to the SfRangeSelector.
The RangeController is a notifier to which the chart and range selector listen. Therefore, whenever the start and end values change in the RangeController, the chart and range selector update themselves.
Let’s create a chart and initialize the data source. Here, I have currently prepared a working sample with random data.
num _yValue() {
  if (_random.nextDouble() > 0.5) {
    _baseValue += _random.nextDouble();
    return _baseValue;
  } else {
    _baseValue -= _random.nextDouble();
    return _baseValue;
  }
}

@override
void initState() {
  DateTime date = DateTime(2020);
  _chartData = List.generate(_dataCount + 1, (int index) {
    final List<num> values = [_yValue(), _yValue(), _yValue(), _yValue()];
    values.sort();
    return ChartData(
      x: date.add(Duration(days: index)),
      high: values[0],
      low: values[3],
      open: values[1],
      close: values[2],
    );
  });
  _startRange = _chartData[0].x;
  _endRange = _chartData[_dataCount].x;
  _rangeController = RangeController(
    start: _startRange,
    end: _endRange,
  );
  super.initState();
}

@override
Widget build(BuildContext context) {
 ...
  SfCartesianChart(
    margin: EdgeInsets.zero,
    primaryXAxis: const DateTimeAxis(),
    primaryYAxis: const NumericAxis(
      opposedPosition: true,
    ),
    series: <CartesianSeries<ChartData, DateTime>>[
      CandleSeries(
        dataSource: _chartData,
        xValueMapper: (ChartData data, int index) => data.x,
        highValueMapper: (ChartData data, int index) => data.high,
        lowValueMapper: (ChartData data, int index) => data.low,
        openValueMapper: (ChartData data, int index) => data.open,
        closeValueMapper: (ChartData data, int index) => data.close,
      ),
    ],
  ),
 ...
}
The y-axis range will be calculated from 0 as the default range padding is ChartRangePadding.normal. Set the range padding of the NumericAxis to ChartRangePadding.round, which calculates and displays the y-axis range only for the available data points.
primaryYAxis: const NumericAxis(
  ...
  rangePadding: ChartRangePadding.round,
)
Add the ZoomPanBehavior to zoom and pan the chart. Here, the zoom mode is set to X because the range selector has no vertical orientation, so we can use it for one-direction(horizontal) zooming.
late ZoomPanBehavior _zoomPanBehavior;

@override
void initState() {
 _zoomPanBehavior = ZoomPanBehavior(
    enablePanning: true,
    zoomMode: ZoomMode.x,
  );
  ...
}

SfCartesianChart(
  ...
  zoomPanBehavior: _zoomPanBehavior,
  ...
)
Now, create the SfRangeSelector and set the min and max values from the chart data source. Since the SfRangeSelector does not have built-in auto interval calculation support, we need to set the interval, dateFormat, and dateIntervalType properties manually. In the following code example, we’ll customize the Jan label with its year using the labelFormatterCallback event for better visual appeal.
Since the SfRangeSelector acts as a mini-map, we can add any cartesian series (based on need) as its child and map the same data source used above.
SfRangeSelectorTheme(
  data: SfRangeSelectorThemeData(
    thumbRadius: 0,
    overlayRadius: 0,
    activeRegionColor: colorScheme.primary.withOpacity(0.12),
    inactiveRegionColor: Colors.transparent,
  ),
  child: SfRangeSelector(
    min: _startRange,
    max: _endRange,
    showTicks: true,
    showLabels: true,
    interval: 1,
    dateIntervalType: DateIntervalType.months,
    dateFormat: DateFormat.MMM(),
    labelPlacement: LabelPlacement.betweenTicks,
    labelFormatterCallback:
        (dynamic actualValue, String formattedText) {
          if (formattedText.contains('Jan')) {
              final year = DateFormat('yyyy').format(actualValue);
              return ' $year $formattedText';
          }
          return formattedText;
        },
        child: SfCartesianChart(
            ...
        ),
    ),
)
Now, wrap the Flutter Charts and the Range Selector widgets in a Column widget. Then, create a range controller and assign it to the chart and the range selector.
RangeController? _rangeController;

@override
void initState() {
  ...
  _rangeController = RangeController(
    start: _startRange,
    end: _endRange,
  );
  super.initState();
}

@override
Widget build(BuildContext context) {
  ...
  Column(
    children: <Widget>[
      Expanded(
        child: SfCartesianChart(
          margin: EdgeInsets.zero,
          primaryXAxis: DateTimeAxis(
            rangeController: _rangeController,
          ),
         ...
        ),
      ),
      Container(
        height: 150,
        padding: const EdgeInsets.only(bottom: 10),
        child: SfRangeSelectorTheme(
          ...
          child: SfRangeSelector(
            min: _startRange,
            max: _endRange,
            controller: _rangeController,
            ...
          ),
        ),
      ),
    ],
  )
  ...
}
That’s it. Now, whenever the axis range changes in the Flutter Chart, the Range Selector will update accordingly and change the Chart’s visual range through interaction with the Range Selector.
Refer to the following image.

Adding a scrollbar on X-axis
This can be achieved by using the SfRangeSelector with an empty SizedBox as its child and placing it on the x-axis using the Flutter Charts annotation property. Let’s have the actual Chart’s data point range as the range of the SfRangeSelector and make it a scrollbar on the X-axis.
To display the default scrollbar UI, remove the thumb and overlay from the SfRangeSelector using the SfRangeSelectorTheme.
Initialize the data source and find its minimum and maximum values. Set these values as the range for the SfRangeSelector.
Refer to the following code example.
late List<ChartData> _chartData;
late DateTime _xScrollbarStartRange;
late DateTime _xScrollbarEndRange;
RangeController? _xScrollbarController;

@override
void initState() {
  ...
  _xScrollbarStartRange = _chartData[0].x;
  _xScrollbarEndRange = _chartData[_dataCount].x;
  _xScrollbarController = RangeController(
    start: _xScrollbarStartRange,
    end: _xScrollbarEndRange,
  );
  super.initState();
}

SfCartesianChart(
  ...
  series: <CartesianSeries<ChartData, DateTime>>[
    HiloOpenCloseSeries(
      dataSource: _chartData,
      ...
    ),
  ],
  zoomPanBehavior: _zoomPanBehavior,
  ...
)

SfRangeSelectorTheme(
  data: const SfRangeSelectorThemeData(
    thumbRadius: 0,
    overlayRadius: 0,
  ),
  child: SfRangeSelector(
    min: _xScrollbarStartRange,
    max: _xScrollbarEndRange,
    child: const SizedBox(height: 0),
  ),
)
Create a range controller and assign it to both the chart’s axis and the range selector so they will map to each other and get updated when the range changes.
void initState() {
  ...
  _xScrollbarController = RangeController(
    start: _xScrollbarStartRange,
    end: _xScrollbarEndRange,
  );
  super.initState();
}

@override
Widget build(BuildContext context) {
SfCartesianChart(
  margin: EdgeInsets.zero,
  primaryXAxis: DateTimeAxis(
    rangeController: _xScrollbarController,
  ),
 ...
)

SfRangeSelector(
  min: _xScrollbarStartRange,
  max: _xScrollbarEndRange,
  controller: _xScrollbarController,
  showTicks: true,
  ...
)
Now, add an annotation to the chart and place the SfRangeSelector as a child of the annotation.
SfCartesianChart(
  ...
  annotations: [
    CartesianChartAnnotation(
      widget: SfRangeSelectorTheme(
        data: const SfRangeSelectorThemeData(
          thumbRadius: 0,
          overlayRadius: 0,
        ),
        child: SfRangeSelector(
          min: _xScrollbarStartRange,
          max: _xScrollbarEndRange,
          controller: _xScrollbarController,
          child: const SizedBox(height: 0),
        ),
      ),
    ),
  ],
)
In order to position the range selector on the x-axis, we need to determine the top left position of the x-axis, which is the same as the bottom left position of the plot area. To get the plot area (series) size, write a custom series renderer for the CartesianSeries and override its performLayout method. After calling the super.performLayout method, you can obtain the size of the series.
Refer to the following code example.
series: <CartesianSeries<ChartData, DateTime>>[
  HiloOpenCloseSeries(
    ...
    onCreateRenderer: (ChartSeries<ChartData, DateTime> series) {
      return _HiloOpenCloseSeriesRenderer(this);
    },
  ),
]

class _HiloOpenCloseSeriesRenderer extends HiloOpenCloseSeriesRenderer<ChartData, DateTime> {
  _HiloOpenCloseSeriesRenderer(this._state);

  final _ChartWithRangeSliderState _state;

  @override
  void performLayout() {
    super.performLayout();
    _state._updateScrollBarSize(size);
  }
}
After obtaining the size, modify the annotation position through the postFrameCallback. When using the series’ bottom left position as the annotation’s x and y coordinates, the annotation will be placed in the center of the given position by default because the default horizontalAlignment and verticalAlignment of the annotation is center.
However, in our case, the annotation must consider the position as center left, which can be done by setting the chart’s horizontalAlignment as near and verticalAlignment as center. Despite this adjustment, the scrollbar still did not stretch to the entire axis length, so set the series width to the scrollbar using the SizedBox.
Refer to the following code example.
Size _scrollbarSize = Size.zero;
Offset _verticalScrollbarStart = Offset.zero;

void _updateScrollBarSize(Size size) {
  SchedulerBinding.instance.addPostFrameCallback((Duration timeStamp) {
    if (size != _scrollbarSize) {
      setState(() {
        _scrollbarSize = size;
        _horizontalScrollbarStart = Offset(0, size.height);
      });
    }
  });
}

SfCartesianChart(
  ...
  annotations: [
    CartesianChartAnnotation(
      x: _horizontalScrollbarStart.dx,
      y: _horizontalScrollbarStart.dy,
      coordinateUnit: CoordinateUnit.logicalPixel,
      horizontalAlignment: ChartAlignment.near,
      widget: SizedBox(
        width: _scrollbarSize.width,
        ...
      ),
    ),
  ],
);
Adding a scrollbar on Y-axis
This can be achieved using the vertical SfRangeSlider widget as an annotation on the Flutter Charts widget. We have used the actual chart data point range for the x-axis scrollbar range; now, we will implement a different method for the y-axis scrollbar.
Let’s assume the scrollbar’s minimum value is 0 and the maximum is 1. Based on the range selected in the chart, the scrollbar range will need to be updated. Let’s explore how to accomplish this.
To display the actual scrollbar UI, remove the thumb and overlay from the SfRangeSlider using the SfRangeSliderTheme.
Similar to the x-axis scrollbar, position the scrollbar on the y-axis. Obtain the series size using a custom series renderer and position the vertical SfRangeSlider, stretching its height to the entire axis height.
If the y-axis is placed on the left by default, we can simply position the scrollbar at Offset.zero. If it is positioned on the right side (the opposite position is true), we should get the series size and reposition it through the postFrameCallback.
Refer to the following code example.
void _updateScrollBarSize(Size size) {
  SchedulerBinding.instance.addPostFrameCallback((Duration timeStamp) {
    if (size != _scrollbarSize) {
      setState(() {
        _scrollbarSize = size;
        _verticalScrollbarStart = Offset(size.width, size.height);
      });
    }
  });
}

SfCartesianChart(
  ...
  annotations: [
    CartesianChartAnnotation(
      x: _verticalScrollbarStart.dx,
      y: _verticalScrollbarStart.dy,
      coordinateUnit: CoordinateUnit.logicalPixel,
      verticalAlignment: ChartAlignment.far,
      widget: SizedBox(
        width: 6, // Max size from the active and inactive track.
        height: _scrollbarSize.height,
        child: SfRangeSliderTheme(
          data: const SfRangeSliderThemeData(
            thumbRadius: 0,
            overlayRadius: 0,
          ),
          child: SfRangeSlider.vertical(
            min: 0,
            max: 1,
            values: values,
            ...
          ),
        ),
      ),
    ),
  ],
)
The SfRangeSlider will be updated only when the widget rebuilds with new values. Therefore, wrap it in a ValueListenableBuilder and update the listenable value in the chart’s onActualRangeChanged callback by converting the visible range values into a range from 0 to 1. When changing the listenable value, the ValueListenableBuilder rebuilds its child using the builder callback. Within this callback, use the new range values that were updated in the onActualRangeChanged callback. This will ensure that the SfRangeSlider is updated to reflect the new visible range.
late num _yAxisActualMin;
late num _yAxisActualMax;

SfCartesianChart(
  ...
  onActualRangeChanged: (ActualRangeChangedArgs args) {
    if (args.axisName == 'primaryYAxis') {
      _yAxisActualMin = args.actualMin;
      _yAxisActualMax = args.actualMax;
      SchedulerBinding.instance.addPostFrameCallback((Duration timeStamp) {
        final num actualRange = args.actualMax - args.actualMin;
        double visibleMinNormalized =
            (args.visibleMin - args.actualMin) / actualRange;
        double visibleMaxNormalized =
            (args.visibleMax - args.actualMin) / actualRange;
        _yScrollbarSelectedValues.value =
            SfRangeValues(visibleMinNormalized, visibleMaxNormalized);
      });
    }
  },
  annotations: [
    CartesianChartAnnotation(
      ...
      widget: SizedBox(
        width: 6,
        height: _scrollbarSize.height,
        child: ValueListenableBuilder<SfRangeValues>(
          valueListenable: _yScrollbarSelectedValues,
          builder: (BuildContext context, SfRangeValues values, Widget? child) {
            return SfRangeSliderTheme(
              ...
              child: SfRangeSlider.vertical(
                min: 0,
                max: 1,
                values: values,
                ...
              ),
            );
          },
        ),
      ),
    ),
  ],
)
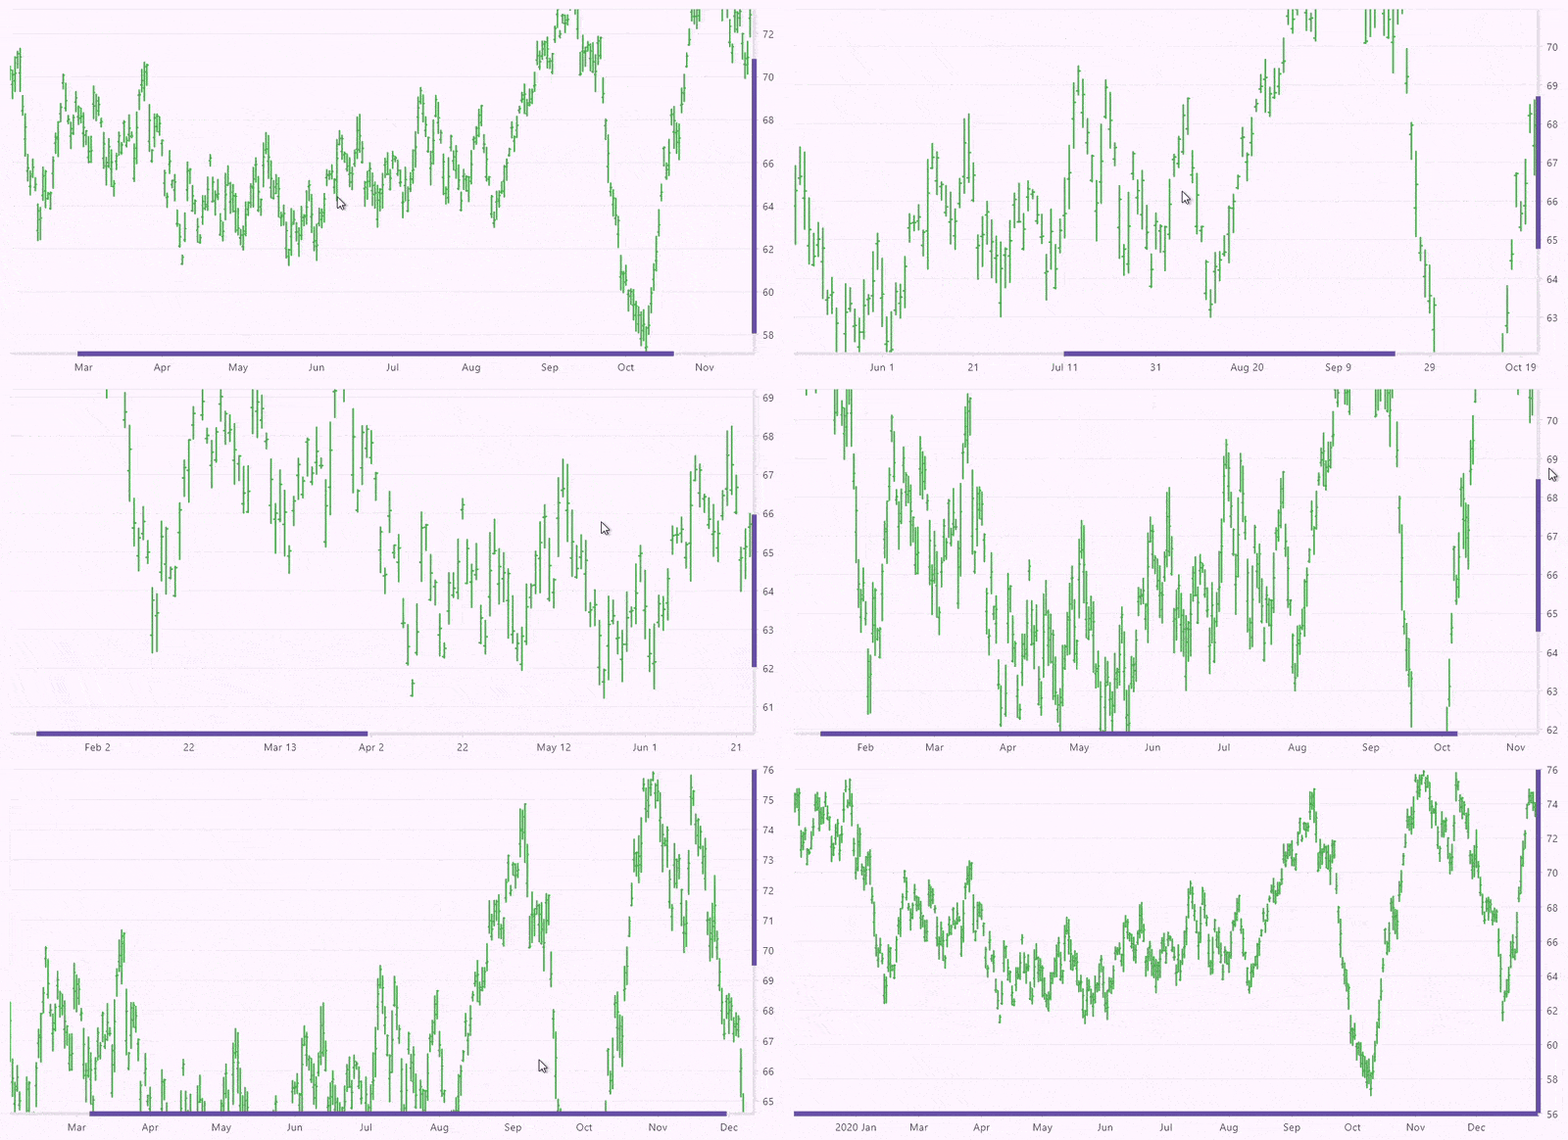
That’s it. Now, the y-axis scrollbar will be updated whenever the y-axis range changes through chart interactions or direct APIs. One more thing: if you need to update the chart range when dragging and updating the y-axis scrollbar (range slider), convert the onChanged new values to actual values and update them to the chart axis controller’s visible min and max properties.
late NumericAxisController _yAxisController;

SfCartesianChart(
  ...
  primaryYAxis: NumericAxis(
    ...
    onRendererCreated: (NumericAxisController controller) {
      _yAxisController = controller;
    },
  ),
)

SfRangeSlider.vertical(
  min: 0,
  max: 1,
  values: values,
  onChanged: (SfRangeValues newValues) {
    _yAxisController.visibleMinimum = lerpDouble(
        _yAxisActualMin, _yAxisActualMax, newValues.start);
    _yAxisController.visibleMaximum = lerpDouble(
        _yAxisActualMin, _yAxisActualMax, newValues.end);
  },
)
Refer to the following image.

GitHub reference
For more details, refer to adding scrollbars in the Flutter Charts GitHub demo.

Unlock the power of Syncfusion’s highly customizable Flutter widgets.
Conclusion
Thanks for reading! In this blog, we learned how to add and synchronize scrollbars in the Syncfusion Flutter Charts widget. With this, you can seamlessly zoom and pan in the charts to view the data points in detail and get insights. Give it a try, and leave your feedback in the comment section below.
Check out other features of our Flutter Charts and Sliders in the user guide and explore our Flutter Charts and Sliders widget samples. Additionally, check out our demo apps available on different platforms: Android, iOS, web, Windows, and Linux.
If you need a new widget for the Flutter framework or new features in our existing widgets, you can contact us through our support forums, support portal, or feedback portal. As always, we are happy to assist you!


