Welcome to our latest blog post! We are thrilled to introduce the 2023 Volume 3 release of Syncfusion Essential JS 2. This release is packed with exciting new features, enhancements, and updates to make your development process smoother and more efficient.
From significant improvements in performance and security to the introduction of brand-new components, this release is designed to help you easily create robust, high-performing applications.
So, let’s dive in and explore what’s new in Syncfusion Essential JS 2 in 2023 Volume 3 that elevates your JavaScript development experience.
Common
In Essential JS 2, we’ve significantly improved some key features:
- Global Animation: Efficiently control animations in JS 2 components from a single location. You can now easily activate or deactivate them, allowing for streamlined animation management across all components.
- Live Vue Demos Upgrade with StackBlitz Option: We’ve gone the extra mile to enhance your experience with live Vue demos. These demos now showcase the latest improvements with Vue 3. Moreover, we’ve added a StackBlitz option, allowing you to test these live Vue demos.
- Vue 3 Intellisense: Elevate your coding experience with Vue 3 using the Volar extension within Visual Studio Code. This extension provides accurate suggestions, making development smoother and more efficient.
Virtual Scrolling in Dropdown Inputs
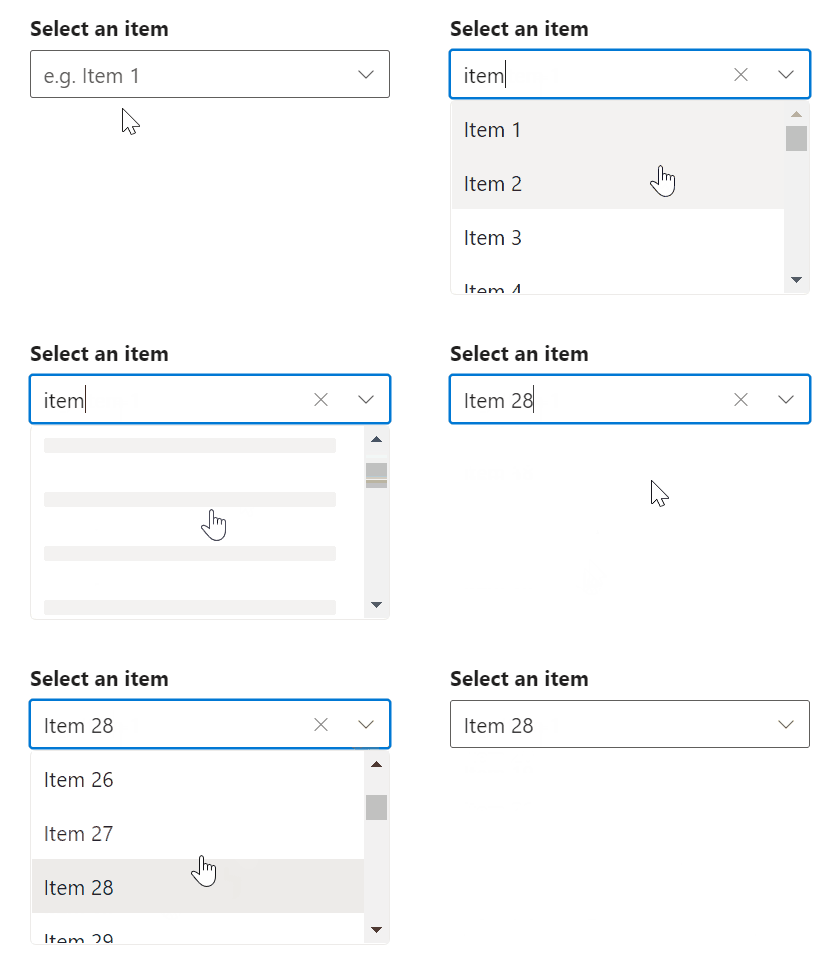
The AutoComplete, ComboBox, and Dropdown List components now offer virtual scrolling support. This feature allows seamless navigation through extensive lists of options without loading all items simultaneously, significantly enhancing the user experience. For more details, refer to the demo link.
Charts
We’ve added several new features and enhancements to the Charts component:
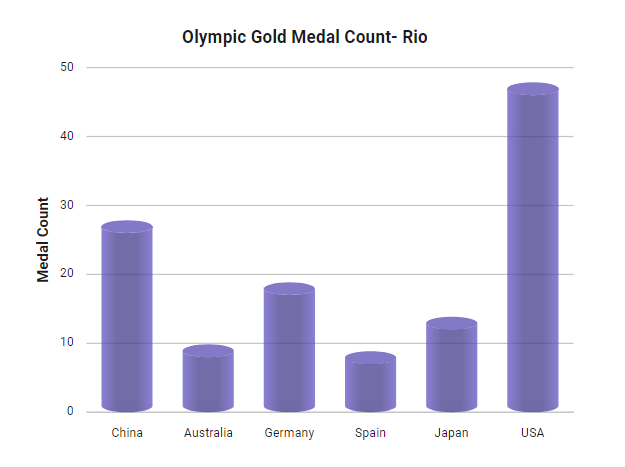
- Cylindrical Chart: Now, users can depict data in cylindrical shapes in column or bar graphs, adding a unique and visually appealing aspect. This 3D transformation of each data point makes charts more engaging and more accessible to interpret, particularly when emphasizing specific data points. Experience a new angle of data visualization with our cylindrical chart feature. You can check out the live demo to see how it works.

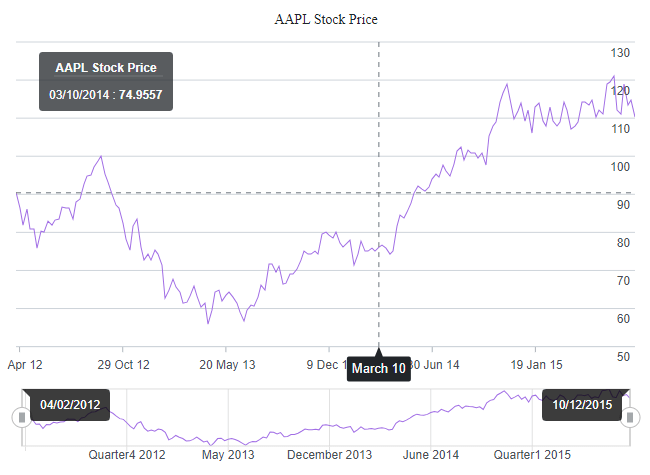
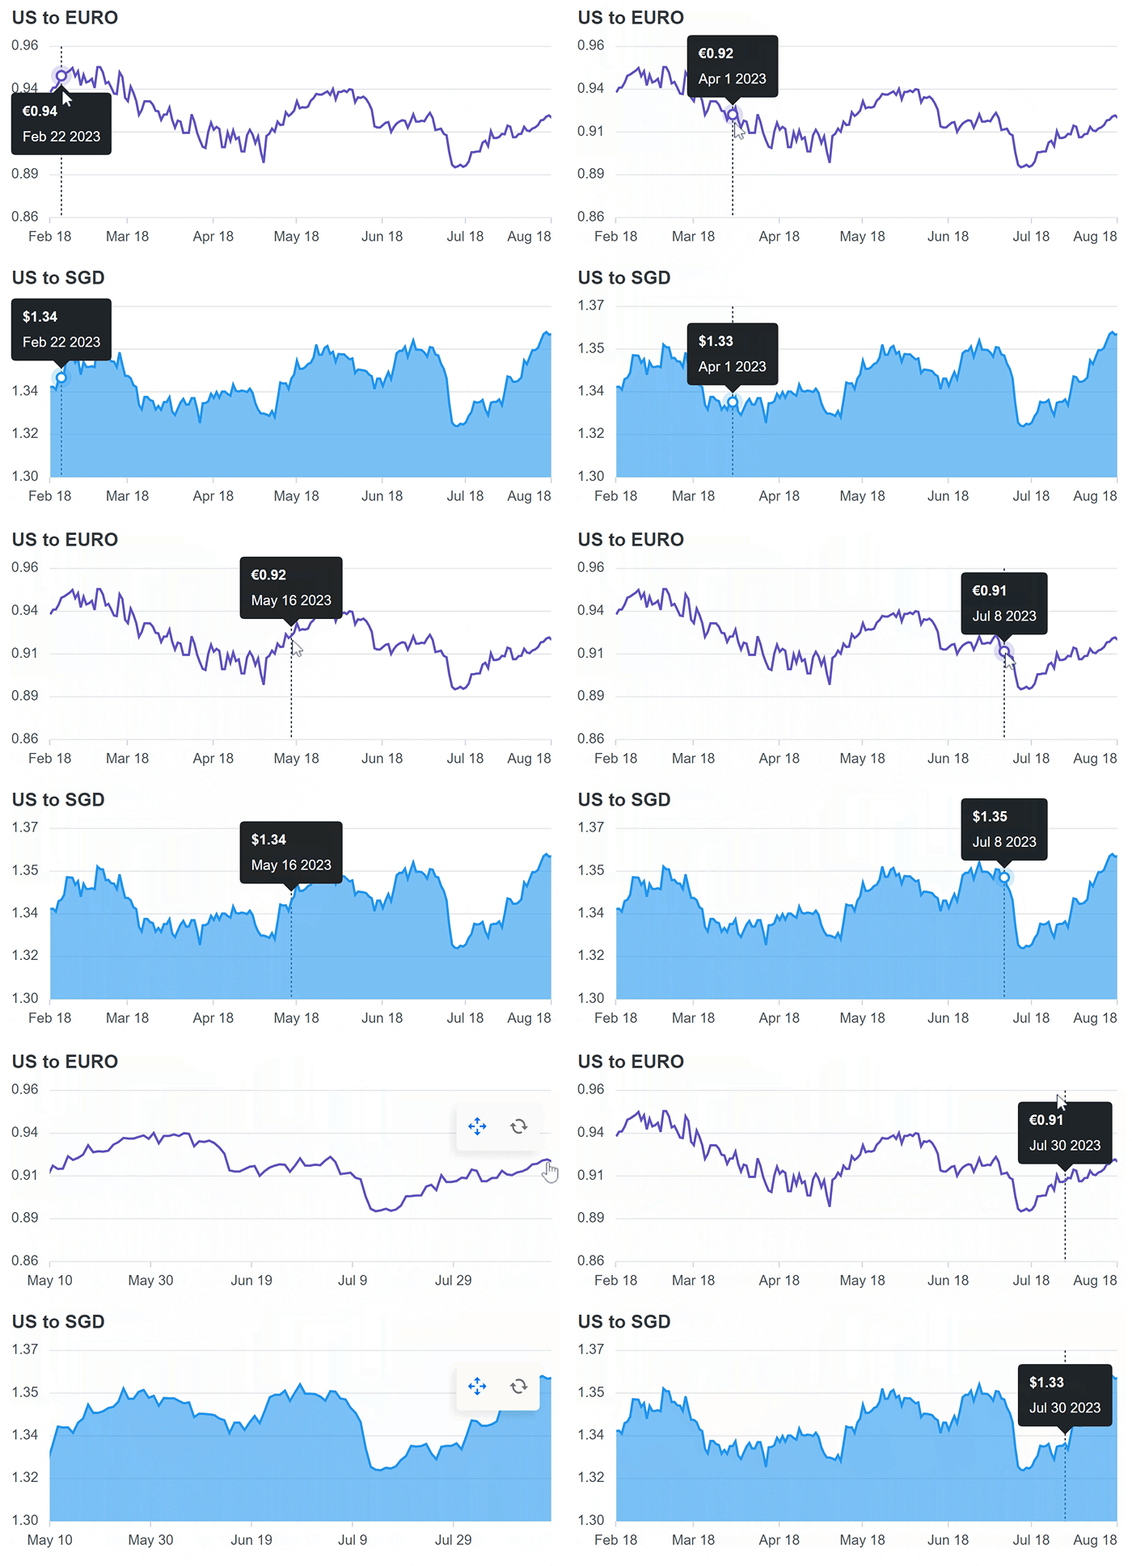
- Synchronized Chart: We’ve enhanced our charts with synchronized tooltip, zooming, panning, crosshairs, highlighting, and selection features for a seamless data visualization experience. For more details, check out the demo now.
- Title Style: Customize your chart titles and subtitles with background and border styles, making your charts clear and visually striking.

- Excel Export: Exporting chart data to Excel is now easier than ever. You can export your data in a table format, simplifying data sharing and analysis.
- Export to Multiple Pages: Our enhanced PDF export feature allows you to export charts to multiple pages within a PDF document, facilitating comprehensive and organized reporting.
Word Processor
We have rolled out a new feature for the Word Processor component:
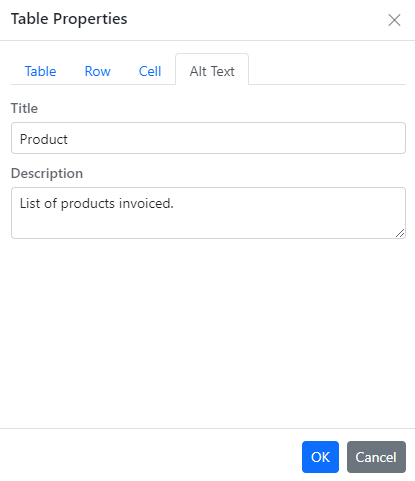
- Table Title and Description: Enhance the accessibility of your Word documents by adding or modifying the title and description of tables. This feature is a valuable aid for visually impaired users in comprehending table content.

File Manager
We have rolled out a new feature for the File Manager component:
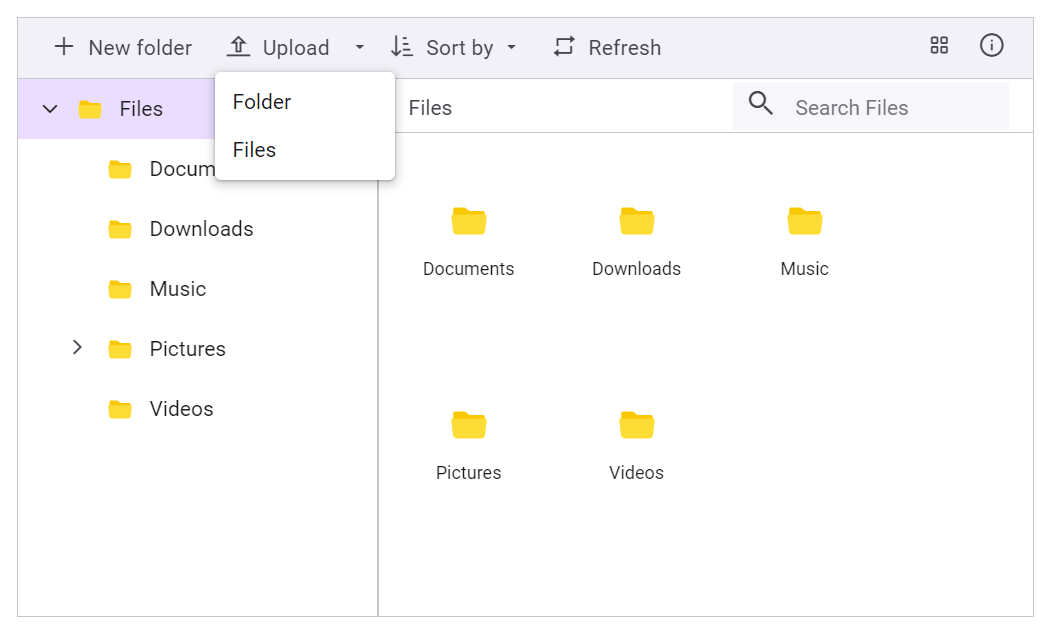
- Toolbar Customization: Enjoy greater flexibility by customizing toolbar items in the File Manager with icons, text, and tooltips. You can fine-tune the user interface to your exact requirements.

Gantt Chart
We’ve added several new features and enhancements to the Gantt Chart component:
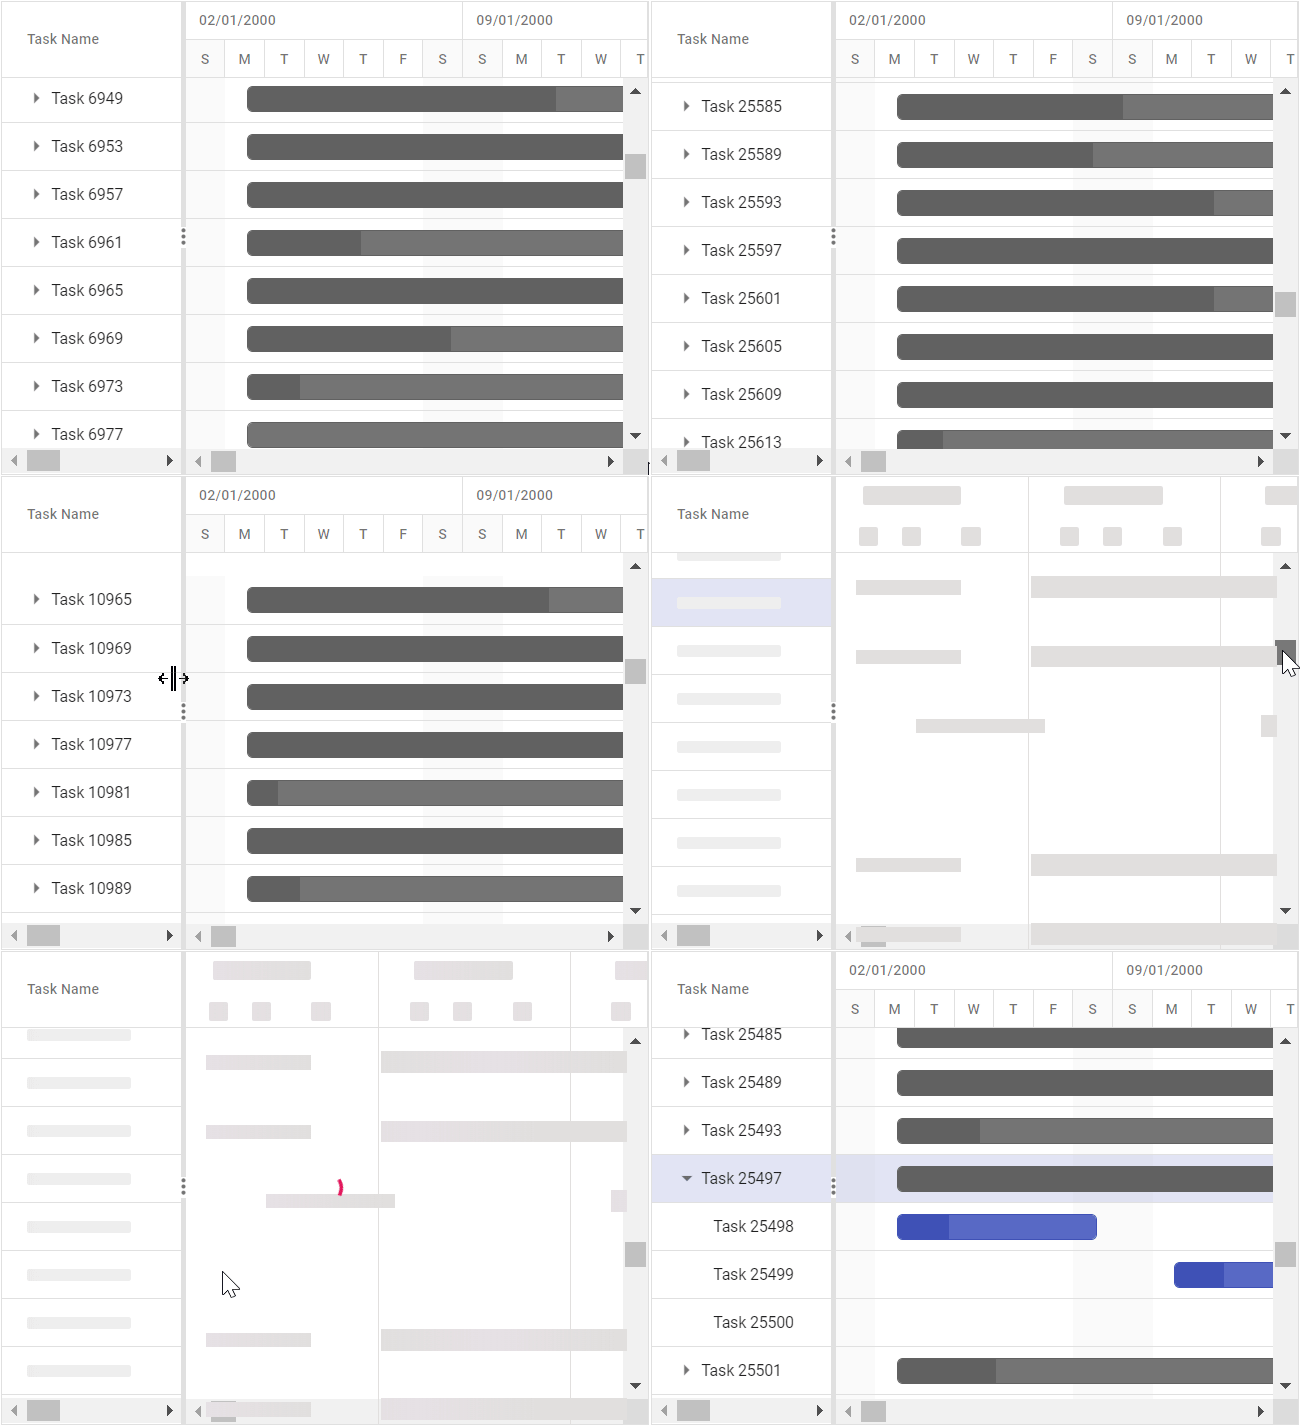
- On-Demand Data Loading (Lazy Loading): Enhance performance and efficiency by loading data from remote web services as needed in the Gantt Chart. Virtual scrolling ensures data retrieval for the current viewport and on-demand for the rest. For more details, refer to the demo link.

- Single-Page Exporting: Export Gantt Chart data to PDF in a single-page format, ensuring comprehensive reports with task details while maintaining readability.
- Baseline Support in PDF Export: The enhanced PDF export feature in the Gantt Chart now includes baseline taskbars, aiding in the visualization of planned versus actual task dates.
DataGrid
The new features added to the DataGrid component are as follows:
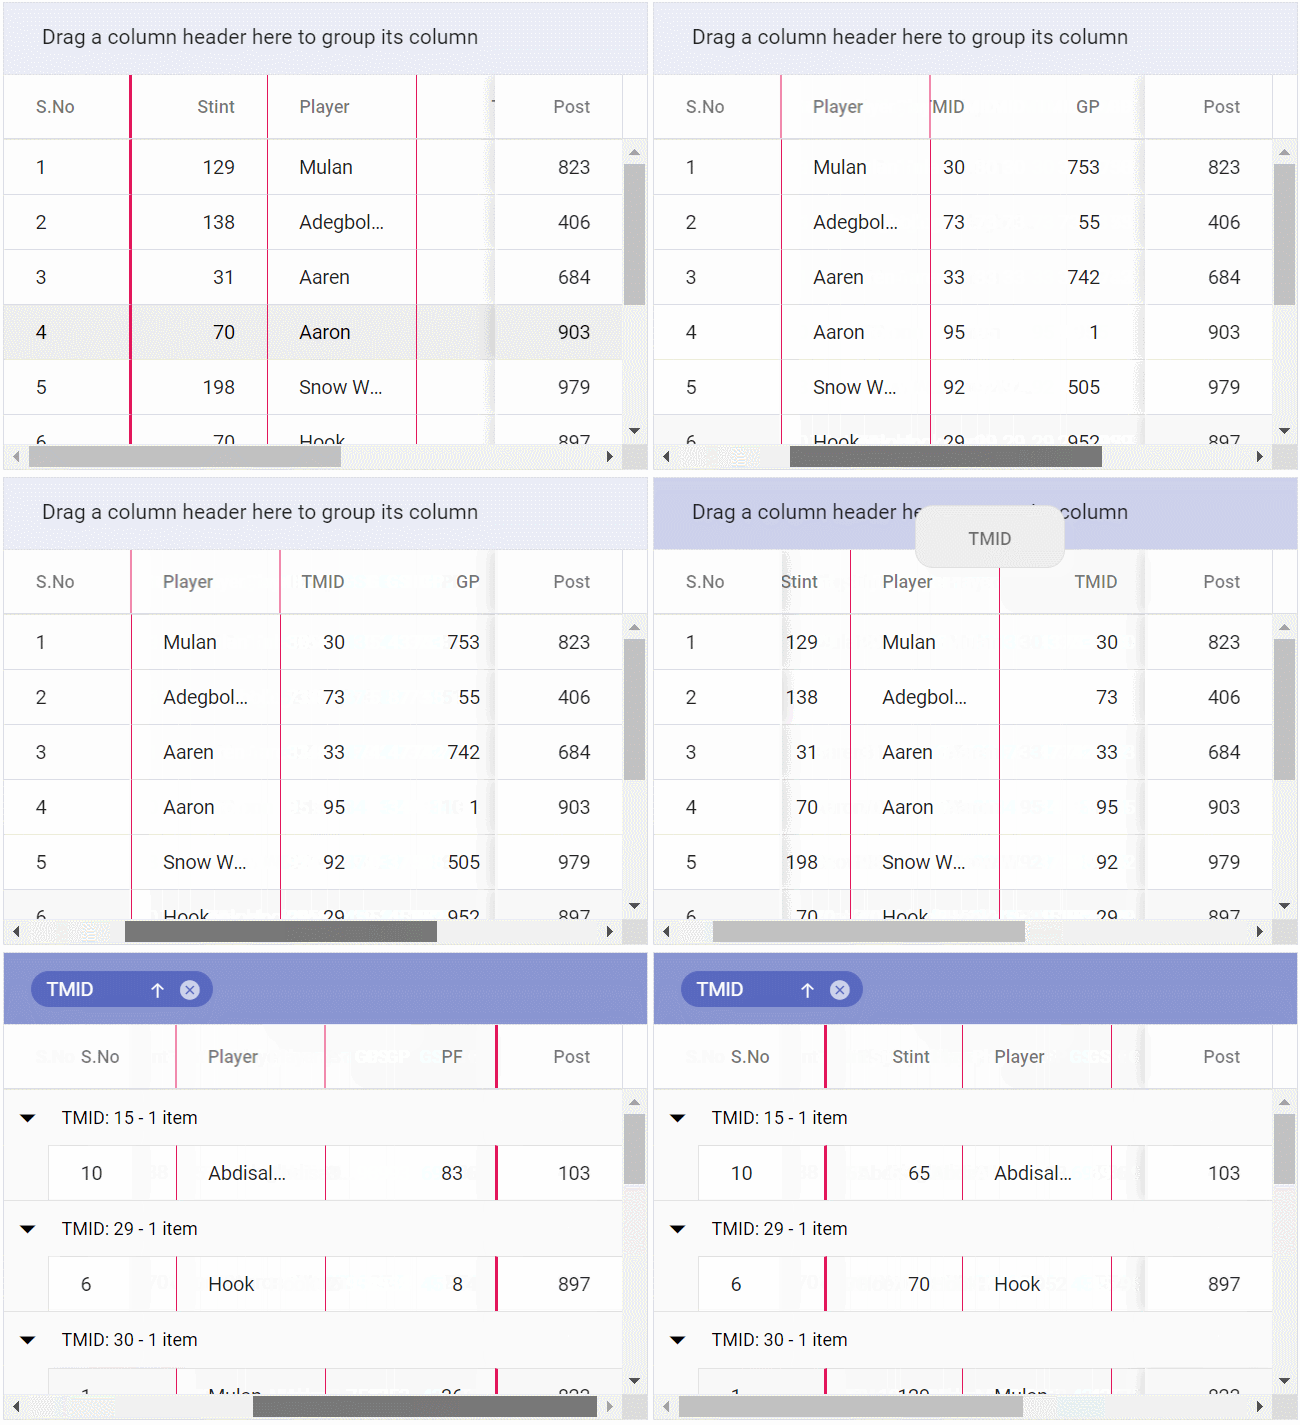
- Enhancements in Frozen Rows and Columns Functionality: In addition to traditional frozen rows and columns, you can lock columns while scrolling horizontally. These enhancements provide greater control over your grid’s layout.

- Export Multiple DataGrids to the Same Page: Exporting multiple grids to page-level Excel and PDF files is now effortless, for both client-side and server-side exporting.
- Export the DataGrid with Column Template and Detail Template: Export the grid with template columns and detail templates to Excel and PDF files, ensuring your exported data retains its formatting.
- Export the DataGrid with Group Caption Template: Customize the grid data export with customized text defined in the group caption row using a caption template for both Excel and PDF files.
Heatmap Chart
The new features added to the Heatmap Chart component are as follows:
- Label Template: Enhance heat map cells by adding custom elements like text, tables, and images, providing richer and more informative visualizations.

Image Editor
The Image Editor component has received the following exciting new updates:
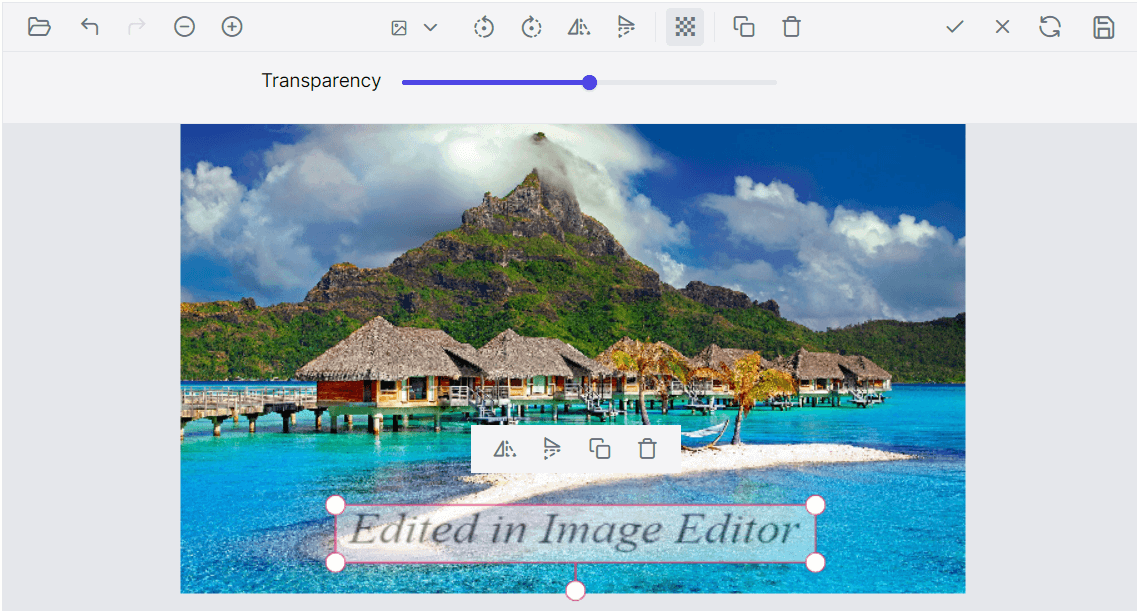
- Image Annotation: You can insert and display multiple images over the main image for various purposes, such as adding logos, watermarks, or decorative elements.

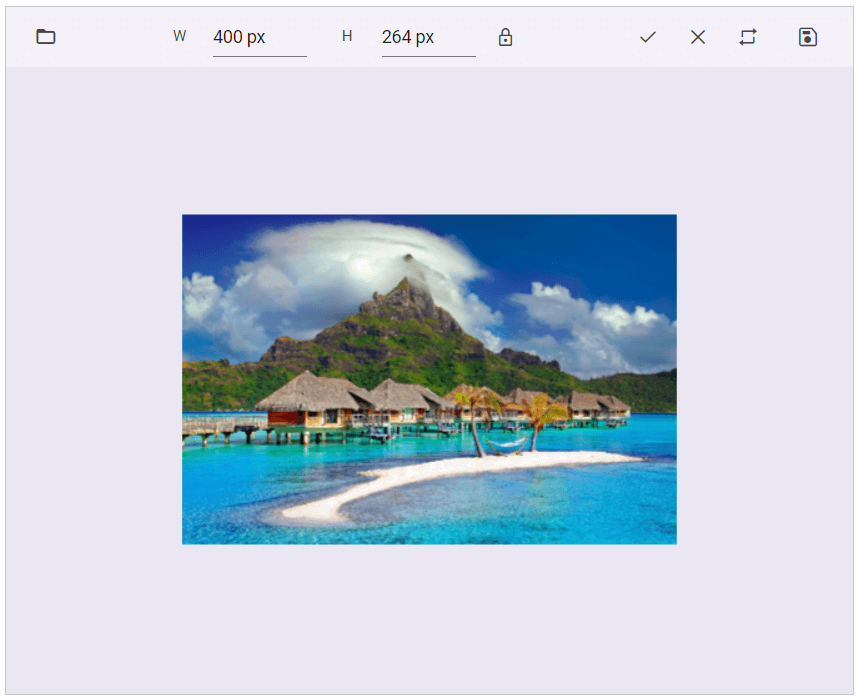
- Image Resize: Tailor images to your specifications by adjusting their dimensions, making them suitable for printing, web display, or other purposes.

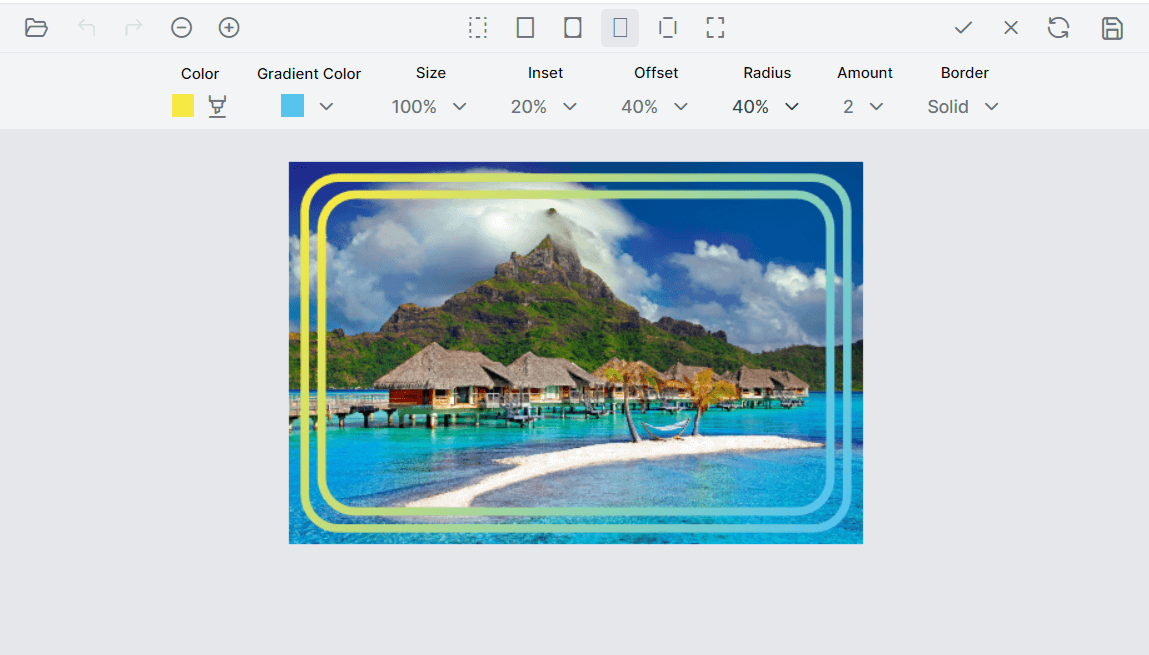
- Image Frame: Add decorative borders as frames around images to enhance their visual appeal and create more striking images.

You can check out the live demo for more details.
Maps
The Maps library has received the following exciting new update:
- Data Label Animation: Use new animated transitions for data labels during the initial rendering of Maps, creating a visually engaging user experience.
PDF Viewer
The PDF Viewer has received the following new update:
- Standalone PDF Viewer: The PDF Viewer component now allows users to view, edit, print, and download PDF files without relying on web services in applications, ensuring fast and responsive PDF handling.
For more details, refer to the demo link.
Pivot Table
The Pivot Table has received the following new update:
- Setting Column Width during PDF Export: You can now set the width of each Pivot Table column when exporting to a PDF document, ensuring your exported data retains its formatting.
Ribbon (preview)
The Ribbon has received the following improvements:
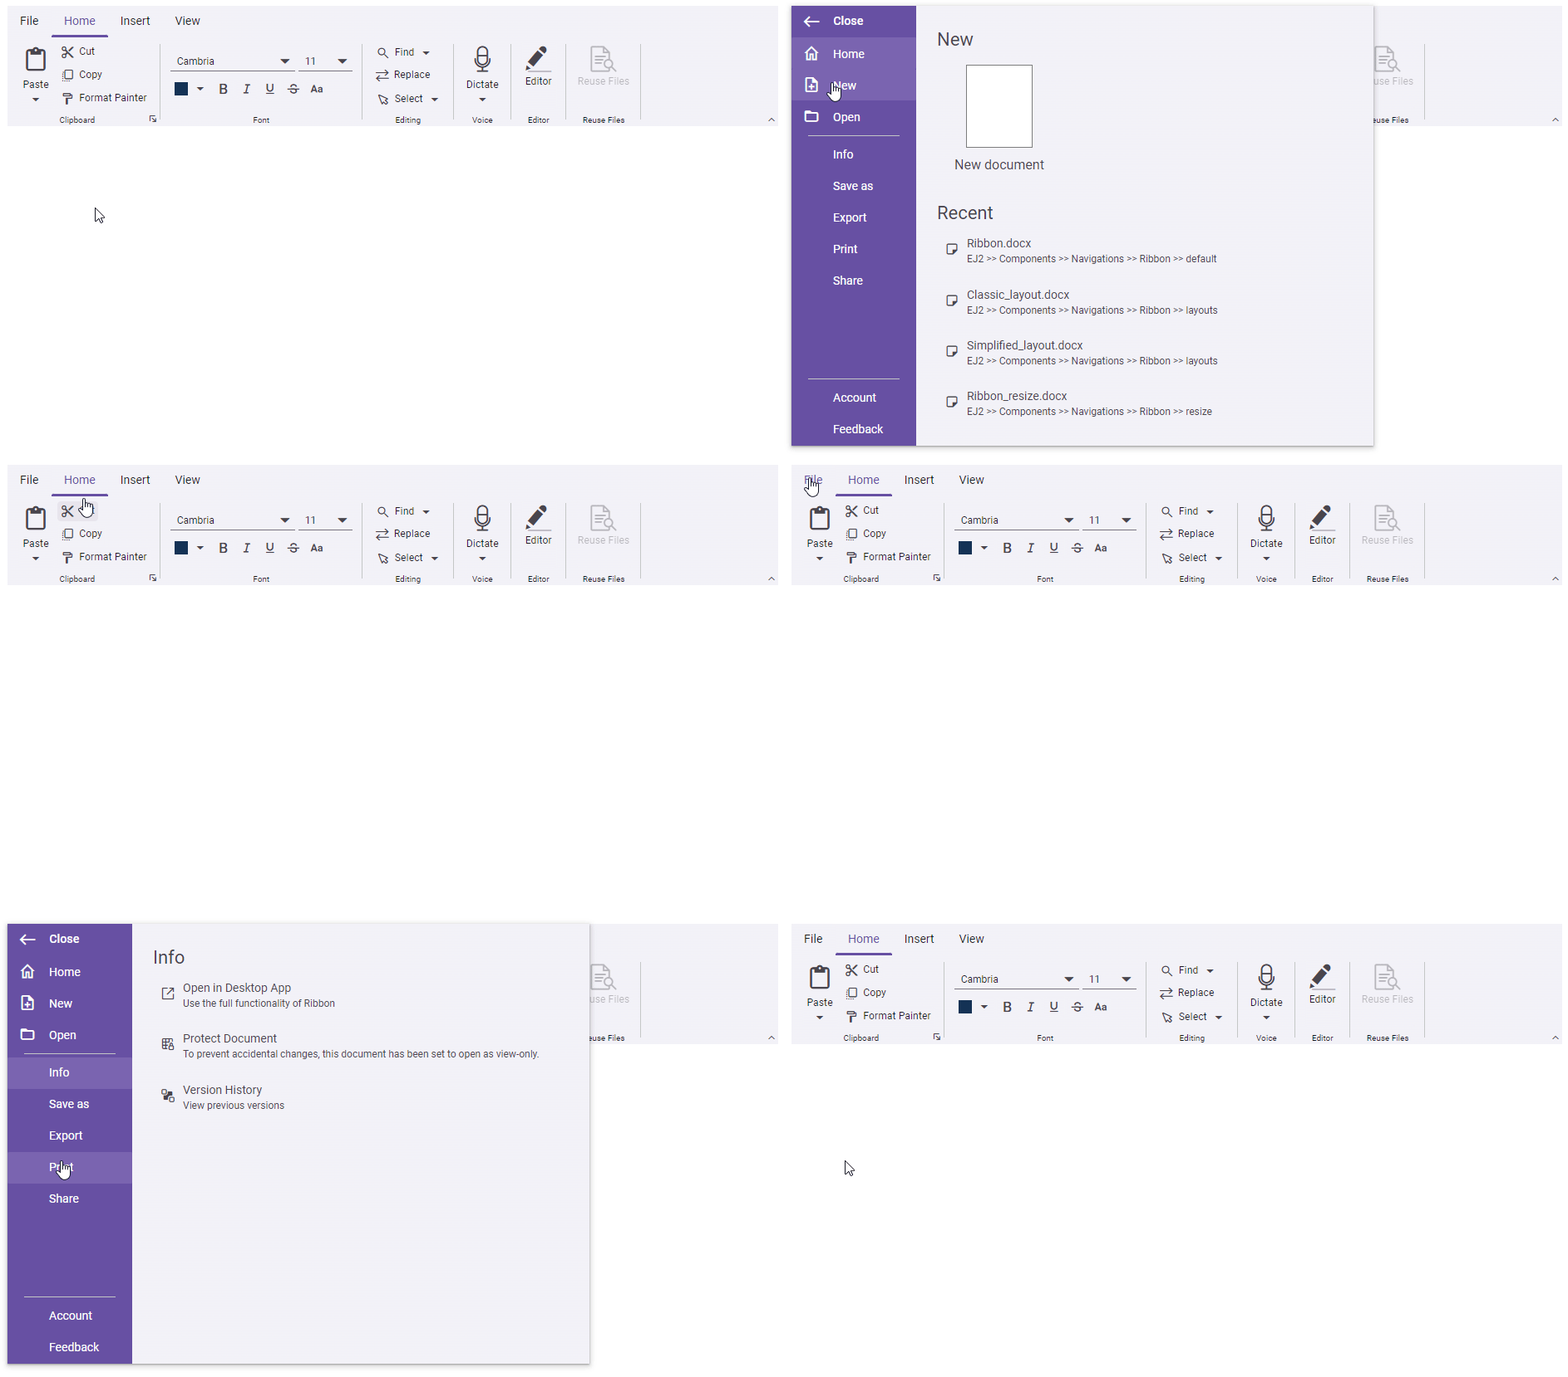
- Group Button Items: The Ribbon component now includes a group button item feature. Users can group multiple button items with single and multiple selections, enhancing user interface design possibilities.

- Backstage Support: Besides the traditional file menu, the Ribbon component now supports a backstage view, displaying application settings, user information, and more. This feature enhances the navigation and accessibility of your application.

Rich Text Editor
The Rich Text Editor component now includes a handy feature to enhance text formatting and content expression:
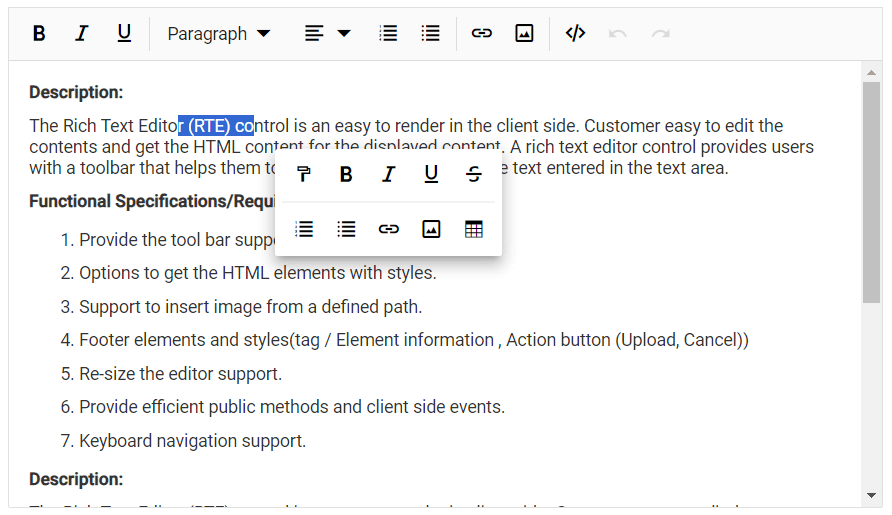
- Quick Format Toolbar for Text: The Rich Text Editor now features a quick format toolbar for text elements. This streamlined editing experience includes built-in items and the option to add custom items for enhanced functionality.

Scheduler
The Scheduler component has two impressive updates:
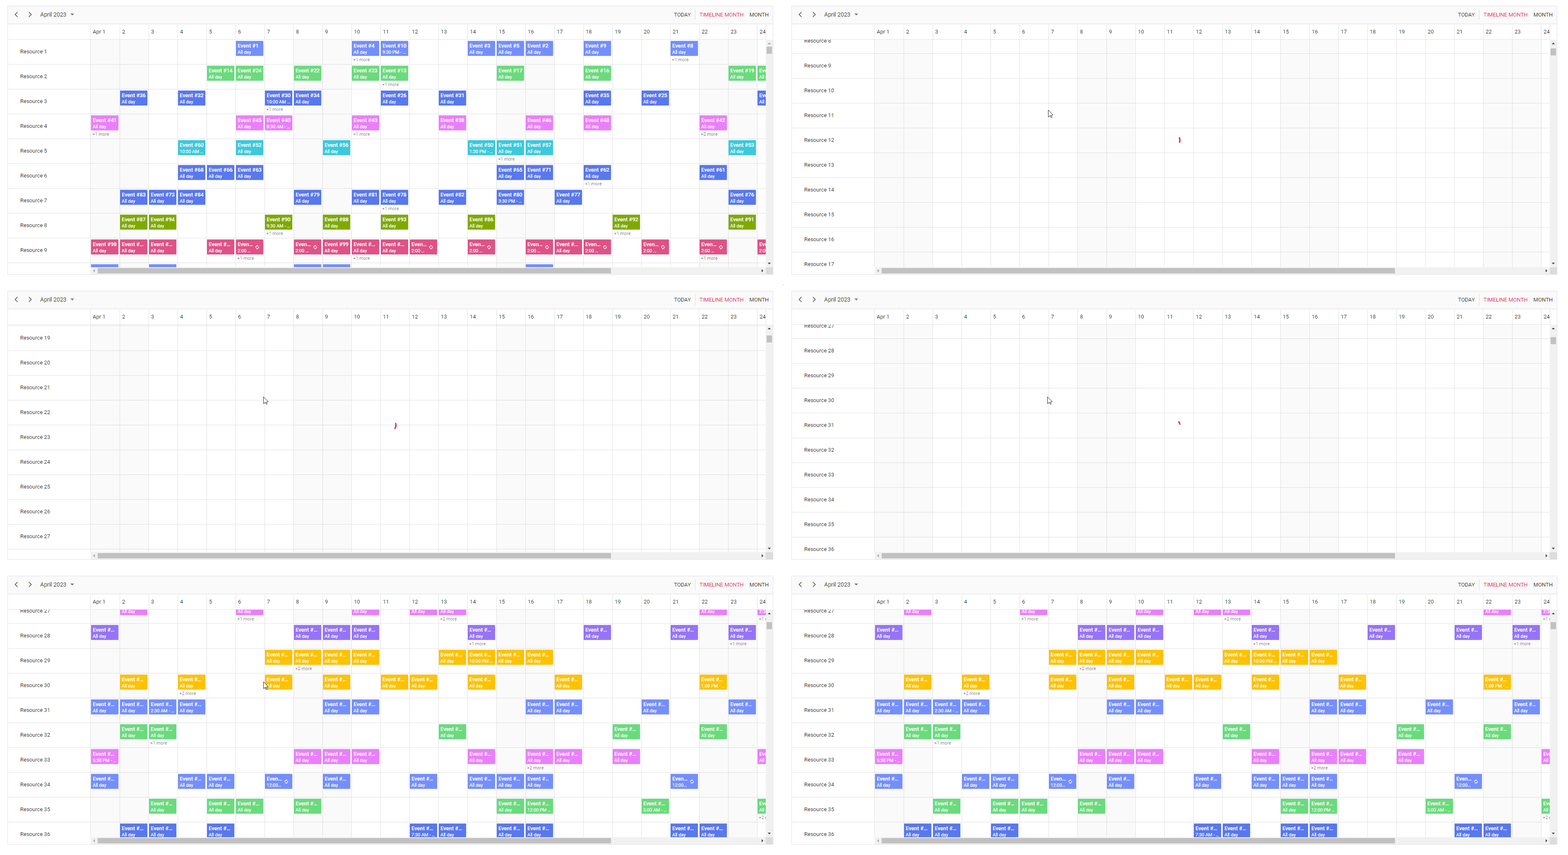
- On-Demand Data Loading (Lazy Loading): Our on-demand data loading feature enhances performance and usability. This feature retrieves events from remote services for the current viewport only, loading additional data as needed when scrolling. Experience this feature in action with our demos.

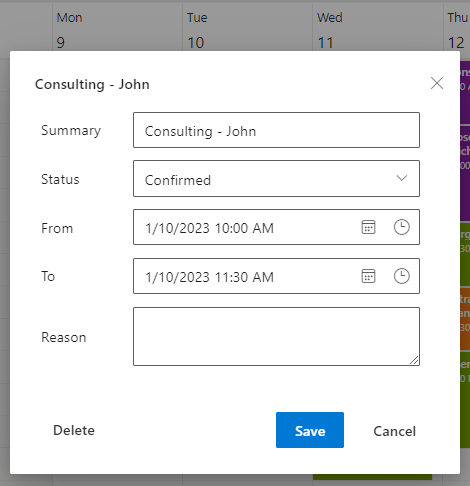
- Editor Window Customization: Tailor the Scheduler component to your specific needs by customizing the header and footer of the built-in editor window, ensuring a seamless user experience. Check out the demo for a hands-on experience.

Spreadsheet
We have upgraded the Spreadsheet component with two enhanced features for an improved user experience:
- Alert Dialog for Invalid Formula: Enhance formula accuracy with the Spreadsheet’s new alert dialog feature. When an invalid formula is entered, an error alert dialog will prompt users to correct it.
- Improved Cut and Paste Performance: Enjoy faster cut-and-paste actions in the Spreadsheet, ensuring a smoother user experience when working with data.
Stock Chart
We’re excited to announce that the Stock Chart component has been enhanced with two new features for your convenience:
- Date-Time Category Axis: Display only business days on a new date-time category axis, providing more focused and relevant information.

- Excel Export: Easily export chart data to Excel in a table format, making it simple to share and analyze data with others.
TreeGrid
Here are the new features that have been incorporated into the TreeGrid component:
- Server-Side Exporting: Export tree grid data to PDF or Excel documents on the server side using server export libraries, enhancing your data reporting capabilities.
Conclusion
Thank you for joining us! This article has discussed the latest updates for the Syncfusion Essential JS 2 platform in the 2023 Volume 3 release. We invite you to explore these user-friendly enhancements and share your thoughts in the comments below.
Please check out our Release Notes and What’s New pages for more details about this release.
Existing customers can download the new version of Essential Studio® from the License and Downloads page. If you’re new to our platform, we offer a 30-day free trial to explore all features.
For any questions, feel free to reach out via our support forum, support portal, or feedback portal. We’re here to help you!
Related blogs
- Syncfusion Receives 82 G2 Badges, Fall 2023
- Syncfusion Essential Studio® 2023 Volume 3 Is Here!
- You’re Invited to the #CodeParty of the Year: .NET Conf 2023!
- Syncfusion Receives 7 Visual Studio Magazine Reader’s Choice Awards in 2023

