
TL;DR: Learn to analyze sleep patterns using the .NET MAUI Range Column Chart. This guide walks you through setting up the .NET MAUI Toolkit, building a sleep tracker chart, analyzing weekly sleep trends, and adding a sleep quality indicator to gain insights into sleep habits and improve rest.
Welcome to the Chart of the Week blog series!
In this edition, we’ll analyze sleep patterns using the Syncfusion .NET MAUI Toolkit Range Column Chart.
Syncfusion .NET MAUI Toolkit
The Syncfusion .NET MAUI Toolkit provides a rich set of UI controls, enabling developers to create interactive cross-platform apps. The toolkit includes a wide range of controls, including charts, tab view, and more. Additionally, it offers free licensed controls with open-source contributions for enhanced customization and community support.
Why sleep pattern tracking is essential?
Tracking sleep patterns is crucial for maintaining a healthy lifestyle. By analyzing sleep duration and quality, individuals can make informed decisions to improve their rest.
By following the below steps, we can track and interpret sleep patterns effectively using our .NET MAUI Toolkit Range Column Chart.
Step 1: Configuring the .NET MAUI Toolkit
Before creating the sleep tracker, install the Syncfusion .NET MAUI Toolkit by following the official documentation and set up the necessary dependencies.
Step 2: Preparing the sleep detail ViewModel
To structure our sleep tracking data, we use the SleepDetailViewModel class, which contains the following properties to track the different sleep phases, including Awake, REM, Core, and Deep.
- Date: Tracks the sleep date.
- TimeInBed: Total hours in bed.
- TimeAsleep: Actual sleep duration.
Refer to the following code example.
public class SleepDetailViewModel
{
    public DateTime Date { get; set; }
    public TimeSpan TimeInBed { get; set; }
    public TimeSpan TimeAsleep { get; set; }

    public ObservableCollection<ChartSleepPhase> AwakePhases { get; set; }
    public ObservableCollection<ChartSleepPhase> REMPhases { get; set; }
    public ObservableCollection<ChartSleepPhase> CorePhases { get; set; }
    public ObservableCollection<ChartSleepPhase> DeepPhases { get; set; }

    public SleepDetailViewModel()
    {
        // Initialize with sample data from the image
        Date = new DateTime(2023, 5, 22);
        TimeInBed = new TimeSpan(7, 11, 0);
        TimeAsleep = new TimeSpan(5, 28, 0);

        // Initialize sleep phase collections with sample data
        InitializeSampleSleepPhases();
    }

    private void InitializeSampleSleepPhases()
    {
        // Convert from hours to actual hour values (10pm to 5am)
        double startHour = 22.0; // 10pm

        AwakePhases = new ObservableCollection<ChartSleepPhase>
        {
            // Early evening awakeness
            new ChartSleepPhase { Start = 0, End = 0.3 },
            new ChartSleepPhase { Start = 1.5, End = 1.7 },

            // Middle of the night awakenings
            new ChartSleepPhase { Start = 4.0, End = 4.2 },
            new ChartSleepPhase { Start = 5.0, End = 5.1 },
            new ChartSleepPhase { Start = 5.4, End = 5.5 },
            new ChartSleepPhase { Start = 5.7, End = 5.8 },
            new ChartSleepPhase { Start = 5.9, End = 6.0 },

            // Early morning awakenings
            new ChartSleepPhase { Start = 6.2, End = 6.3 },
            new ChartSleepPhase { Start = 6.4, End = 6.5 },
            new ChartSleepPhase { Start = 6.7, End = 6.8 },
            new ChartSleepPhase { Start = 7.0, End = 7.1 }
        };

        REMPhases = new ObservableCollection<ChartSleepPahse>
        {
            // Early REM phases
            new ChartSleepPhase { Start = 1.7, End = 2.3 },

            // Middle REM phases
            new ChartSleepPhase { Start = 4.2, End = 4.8 },

            // Late REM phases - shorter cycles
            new ChartSleepPhase { Start = 6.0, End = 6.2 },
            new ChartSleepPhase { Start = 6.8, End = 6.9 },
            new ChartSleepPhase { Start = 7.1, End = 7.2 }
        };

        CorePhases = new ObservableCollection<ChartSleepPhase>
        {
            // Initial core sleep
            new ChartSleepPhase { Start = 0.3, End = 0.8 },
            new ChartSleepPhase { Start = 0.9, End = 1.5 },

            // Extended core sleep period
            new ChartSleepPhase { Start = 2.3, End = 4.0 },

            // Later core sleep segments
            new ChartSleepPhase { Start = 4.8, End = 5.0 },
            new ChartSleepPhase { Start = 5.1, End = 5.4 },
            new ChartSleepPhase { Start = 5.5, End = 5.7 },
            new ChartSleepPhase { Start = 5.8, End = 5.9 },

            // Early morning core phases
            new ChartSleepPhase { Start = 6.3, End = 6.4 },
            new ChartSleepPhase { Start = 6.5, End = 6.7 },
            new ChartSleepPhase { Start = 6.9, End = 7.0 }
        };

        DeepPhases = new ObservableCollection<ChartSleepPhase>
        {
            // Only a brief deep sleep phase
            new ChartSleepPhase { Start = 0.8, End = 0.9 }
        };
    }
}

public class ChartSleepPhase
{
    public string Phase { get; set; } = "Sleep";
    public double Start { get; set; }
    public double End { get; set; }
}
Step 3: Preparing the sleep tracker chart
Let’s design the sleep tracker chart to visualize the total time spent in bed and the actual sleep duration using our .NET MAUI Toolkit Range Column Chart, where:
- X-axis represents the date.
- Y-axis represents the sleep duration in hours.
- Each column shows the difference between the time in bed and actual sleep time.
Refer to the following code example.
xmlns:chart="clr-namespace:Syncfusion.Maui.Toolkit.Charts;assembly=Syncfusion.Maui.Toolkit">

. . .

<Border Grid.Row="1" StrokeThickness="1" Background="{StaticResource ChartBackground}"
        Stroke="LightGray" StrokeShape="RoundRectangle 8" Padding="15,5,15,5">

    <!-- Sleep Phases Chart -->
    <chart:SfCartesianChart IsTransposed="True"
                            EnableSideBySideSeriesPlacement="False"
                            HorizontalOptions="Fill"
                            VerticalOptions="Fill">

        <chart:SfCartesianChart.Legend>
            <chart:ChartLegend />
        </chart:SfCartesianChart.Legend>

        <chart:SfCartesianChart.XAxes>
            <chart:CategoryAxis ArrangeByIndex="False"
                                IsVisible="False"
                                ShowMajorGridLines="False" />
        </chart:SfCartesianChart.XAxes>

        <chart:SfCartesianChart.YAxes>
            <chart:NumericalAxis IsVisible="False"
                                 RangePadding="None"
                                 ShowMajorGridLines="False"
                                 ShowMinorGridLines="False" />
        </chart:SfCartesianChart.YAxes>

        <!-- Awake Phase Series -->
        <chart:RangeColumnSeries ItemsSource="{Binding AwakePhases}"
                                 Width="0.5"
                                 XBindingPath="Phase"
                                 High="Start"
                                 Low="End"
                                 Label="Awake"
                                 Fill="{StaticResource AwakeColor}" />

        <!-- REM Phase Series -->
        <chart:RangeColumnSeries ItemsSource="{Binding REMPhases}"
                                 XBindingPath="Phase"
                                 Width="0.5"
                                 High="Start"
                                 Low="End"
                                 Label="REM"
                                 Fill="{StaticResource REMColor}" />

        <!-- Core Phase Series -->
        <chart:RangeColumnSeries ItemsSource="{Binding CorePhases}"
                                 XBindingPath="Phase"
                                 Width="0.5"
                                 High="Start"
                                 Low="End"
                                 Label="Core"
                                 Fill="{StaticResource CoreColor}" />

        <!-- Deep Phase Series -->
        <chart:RangeColumnSeries ItemsSource="{Binding DeepPhases}"
                                 XBindingPath="Phase"
                                 Width="0.5"
                                 High="Start"
                                 Low="End"
                                 Label="Deep"
                                 Fill="{StaticResource DeepColor}" />
    </chart:SfCartesianChart>
</Border>
Refer to the following image.
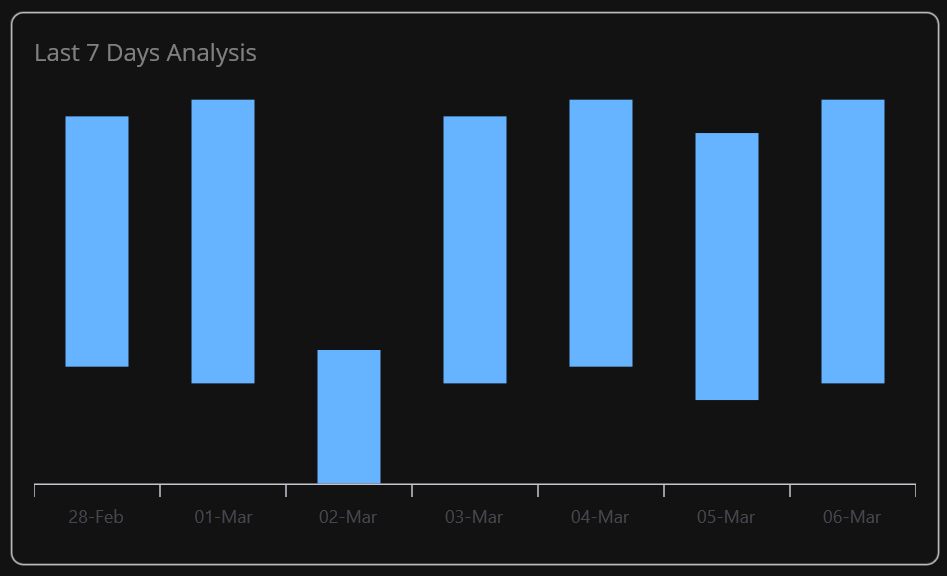
Step 4: Preparing the weekly sleep analyzer
Now, design the weekly sleep analyzer to display the data for the past seven days, allowing users to identify trends in their sleep patterns. By analyzing variations in sleep duration, users can make informed adjustments to improve sleep quality.
Refer to the following code example to implement the SleepTrackerViewModel class, which stores daily sleep duration and sleep quality details. Enabling seamless binding with the chart and progress bar for real-time visualization.
public class SleepTrackerViewModel
{
    public ObservableCollection<SleepData> WeeklySleepData { get; set; }

    public SleepTrackerViewModel()
    {
        WeeklySleepData = new ObservableCollection<SleepData>
        {
            new SleepData { Date = DateTime.Today.AddDays(-7), SleepStart = 22, SleepEnd = 7, SleepQuality = 90 },
            new SleepData { Date = DateTime.Today.AddDays(-6), SleepStart = 23, SleepEnd = 6, SleepQuality = 85 },
            new SleepData { Date = DateTime.Today.AddDays(-5), SleepStart = 0, SleepEnd = 8, SleepQuality = 95 },
            new SleepData { Date = DateTime.Today.AddDays(-4), SleepStart = 22, SleepEnd = 6, SleepQuality = 80 },
            new SleepData { Date = DateTime.Today.AddDays(-3), SleepStart = 23, SleepEnd = 7, SleepQuality = 88 },
            new SleepData { Date = DateTime.Today.AddDays(-2), SleepStart = 21, SleepEnd = 5, SleepQuality = 75 },
            new SleepData { Date = DateTime.Today.AddDays(-1), SleepStart = 23, SleepEnd = 6, SleepQuality = 85 }
        };
    }
}

public class SleepData
{
    public DateTime Date { get; set; }
    public int SleepStart { get; set; } // Hour of sleep start (24-hour format)
    public int SleepEnd { get; set; }   // Hour of sleep end (24-hour format)
    public int SleepQuality { get; set; } // 0-100 scale

    // Computed properties
    public double SleepDuration =>
        SleepEnd >= SleepStart ?
        SleepEnd - SleepStart :
        (24 - SleepStart) + SleepEnd;
}
Weekly analysis:
<Border Grid.Column="0" StrokeThickness="1" Stroke="LightGray" StrokeShape="RoundRectangle 8" Padding="15">
    <VerticalStackLayout Spacing="10">
        <Label Text="Last 7 Days Analysis"
               FontSize="16"
               TextColor="Gray"
               HorizontalOptions="Start" />

        <chart:SfCartesianChart>
            <chart:SfCartesianChart.BindingContext>
                <viewmodels:SleepTrackerViewModel />
            </chart:SfCartesianChart.BindingContext>

            <chart:SfCartesianChart.XAxes>
                <chart:CategoryAxis ShowMajorGridLines="False"
                                    LabelPlacement="BetweenTicks">
                    <chart:CategoryAxis.LabelStyle>
                        <chart:ChartAxisLabelStyle LabelFormat="dd-MMM"/>
                    </chart:CategoryAxis.LabelStyle>
                </chart:CategoryAxis>
            </chart:SfCartesianChart.XAxes>

            <chart:SfCartesianChart.YAxes>
                <chart:NumericalAxis ShowMajorGridLines="False"
                                     IsVisible="False"
                                     Minimum="0"
                                     Maximum="24"
                                     Interval="3"/>
            </chart:SfCartesianChart.YAxes>

            <chart:SfCartesianChart.Series>
                <chart:RangeColumnSeries ItemsSource="{Binding WeeklySleepData}"
                                          XBindingPath="Date"
                                          High="SleepEnd"
                                          Low="SleepStart"
                                          EnableTooltip="True"
                                          Fill="{StaticResource REMColor}"
                                          Spacing="0.3">
                </chart:RangeColumnSeries>
            </chart:SfCartesianChart.Series>

            <chart:SfCartesianChart.TooltipBehavior>
                <chart:ChartTooltipBehavior />
            </chart:SfCartesianChart.TooltipBehavior>
        </chart:SfCartesianChart>
    </VerticalStackLayout>
</Border>
Refer to the following image.
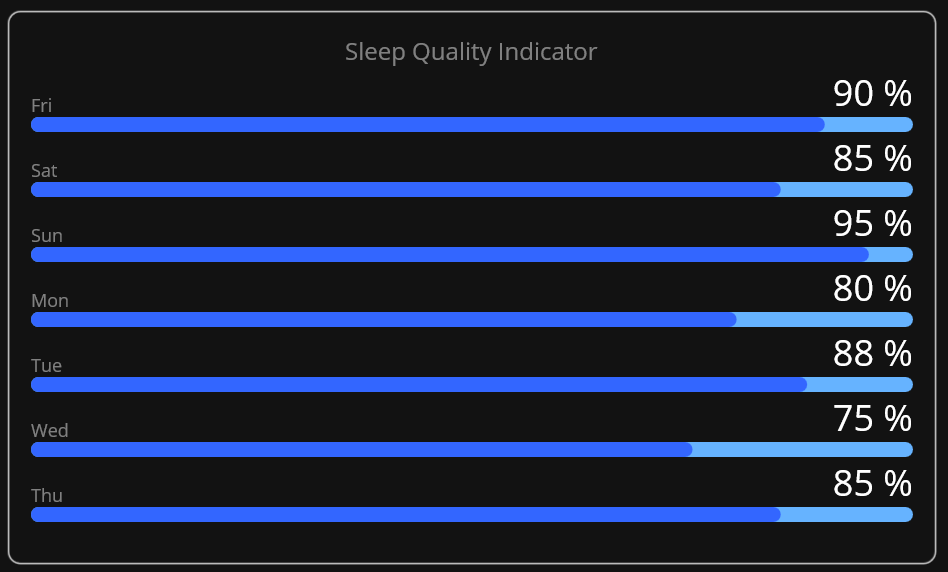
Step 5: Preparing the sleep quality indicator
The Sleep Quality Indicator will visualize sleep efficiency using a horizontal bar chart. Each day of the week will have a corresponding percentage value, indicating how well the user slept compared to their total time in bed using the .NET MAUI Linear Progress Bar to improve the UI.
<Border Grid.Column="1" StrokeThickness="1" Stroke="LightGray" StrokeShape="RoundRectangle 8" Padding="15">
    <!-- Sleep Quality Indicator -->
    <VerticalStackLayout HorizontalOptions="FillAndExpand"
                          VerticalOptions="FillAndExpand"
                          Grid.Row="1" Grid.Column="1"
                          Spacing="0">

        <Label Text="Sleep Quality Indicator"
               FontSize="16"
               VerticalOptions="Start"
               TextColor="Gray"
               HorizontalOptions="Center" />

        <VerticalStackLayout BindableLayout.ItemsSource="{Binding WeeklySleepData}"
                              HorizontalOptions="Start">
            <BindableLayout.ItemTemplate>
                <DataTemplate x:DataType="viewmodels:SleepData">
                    <VerticalStackLayout HorizontalOptions="Center"
                                          VerticalOptions="Center">
                        <Grid ColumnDefinitions="8*,Auto"
                               HorizontalOptions="FillAndExpand">

                            <Label Grid.Row="0"
                                   Text="{Binding Date, StringFormat='{0:ddd}'}"
                                   VerticalTextAlignment="End"
                                   FontSize="12"
                                   TextColor="Gray"
                                   HorizontalOptions="Start" />

                            <Label Grid.Row="1"
                                   HorizontalOptions="EndAndExpand"
                                   HorizontalTextAlignment="End"
                                   Text="{Binding SleepQuality, StringFormat='{0} %'}"
                                   FontSize="24"
                                   TextColor="White" />

                        </Grid>

                        <progressBar:SfLinearProgressBar
                            TrackHeight="10"
                            ProgressHeight="10"
                            ProgressCornerRadius="5"
                            SecondaryProgressCornerRadius="5"
                            TrackCornerRadius="5"
                            Progress="{Binding SleepQuality}"
                            ProgressFill="{StaticResource CoreColor}"
                            TrackFill="{StaticResource REMColor}"
                            Background="Transparent" />
                    </VerticalStackLayout>
                </DataTemplate>
            </BindableLayout.ItemTemplate>
        </VerticalStackLayout>
    </VerticalStackLayout>
</Border>
Refer to the following image.
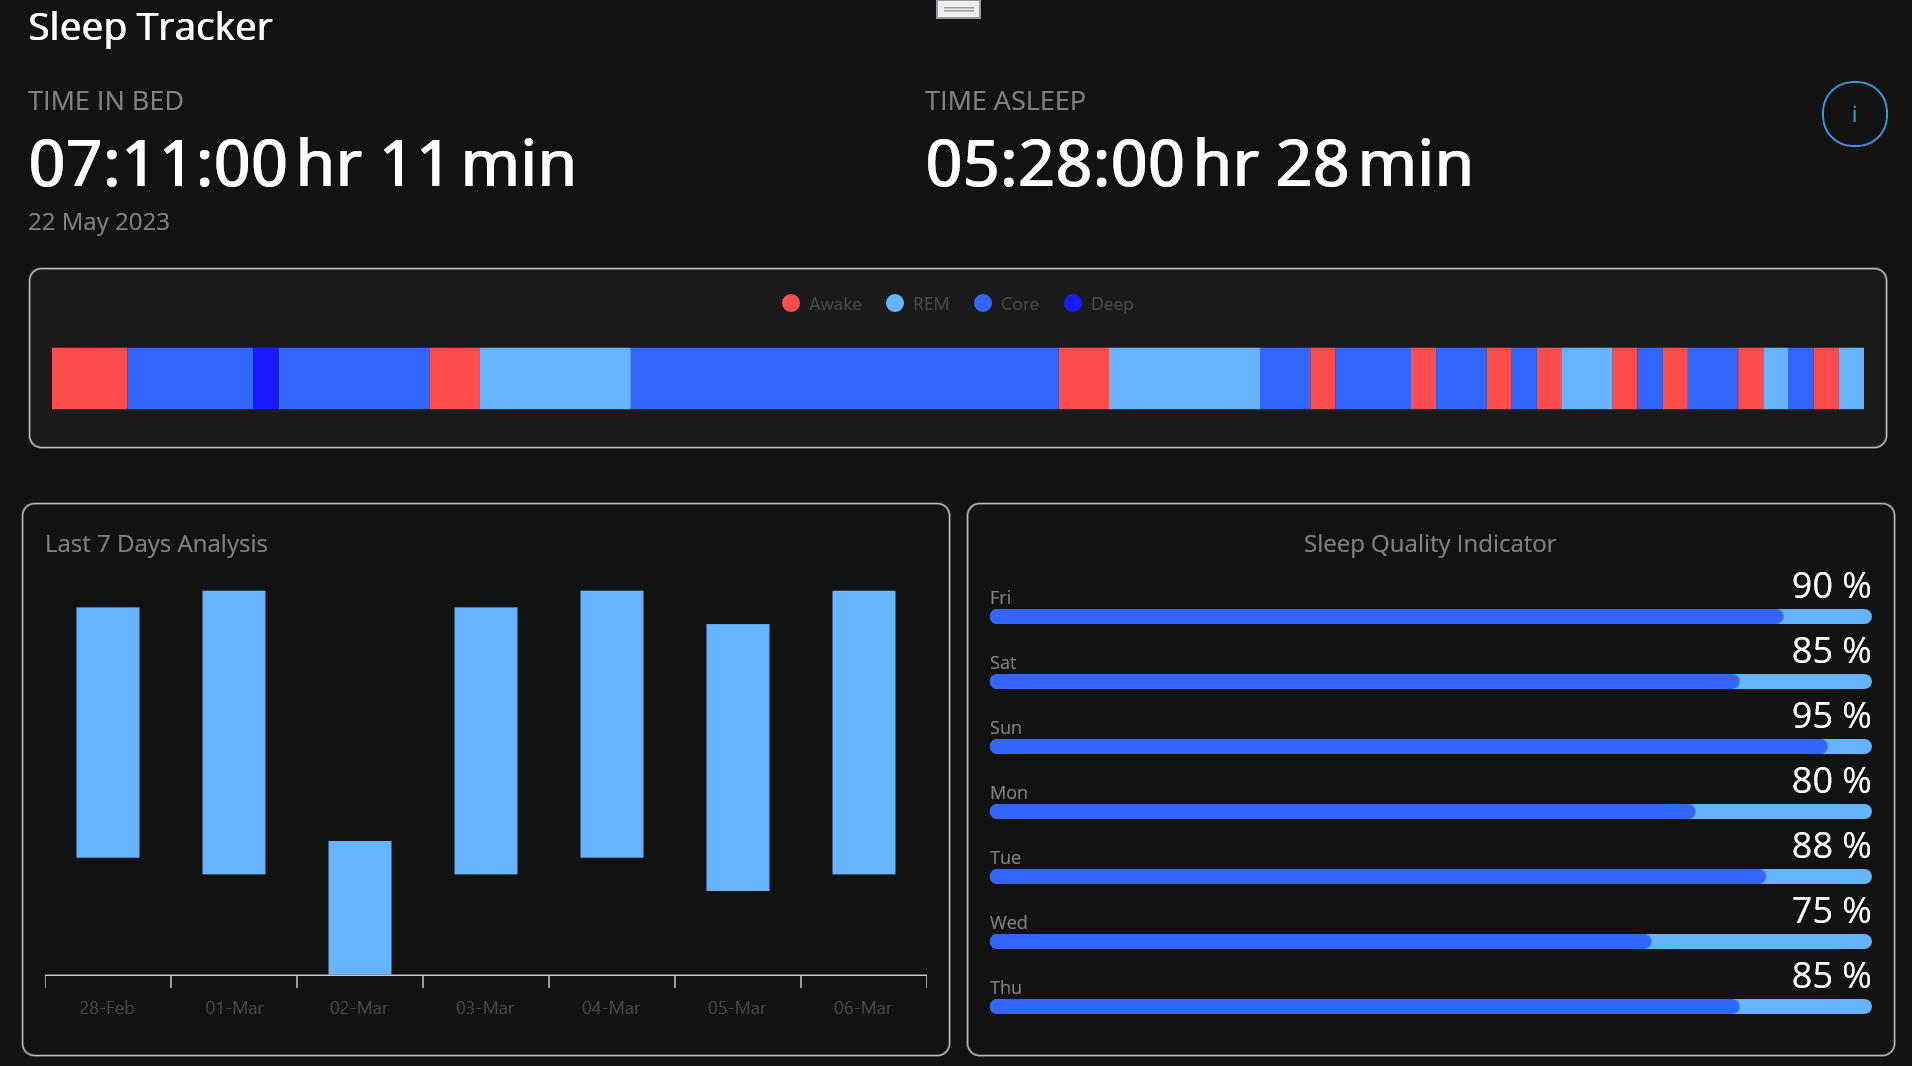
By combining the sleep tracker chart, weekly sleep analyzer, and sleep quality indicator, we create a comprehensive dashboard for sleep analysis. This provides users with valuable insights into their sleeping habits and helps them take steps toward better rest.
<Grid Background="{StaticResource AppBackground}">
    <Grid.RowDefinitions>
        <RowDefinition Height="Auto" />
        <RowDefinition Height="5*" />
        <RowDefinition Height="7*" />
    </Grid.RowDefinitions>

    <Label Grid.Column="0"
           Text="Sleep Tracker"
           Margin="20,0,0,0"
           TextColor="White"
           FontSize="25"
           FontAttributes="Bold" />

    <Grid Grid.Row="1" Padding="20" RowSpacing="20">
        <!-- Sleep Tracker -->
    </Grid>

    <Grid Grid.Row="2" Padding="20" RowSpacing="20">
        <!-- Sleep Analyzer -->
    </Grid>
</Grid>
After executing these code examples, we will get the output that resembles the following image.
GitHub repository
For more details, refer to visualizing sleep patterns with .NET MAUI Toolkit on GitHub repository.

Conclusion
Thanks for reading! In this blog, we’ve explored how to visualize sleep pattern patterns using the Syncfusion® .NET MAUI Toolkit. Stay tuned for next week’s Chart of the Week!
The existing customers can download the latest version of Essential Studio® from the License and Downloads page. If you are new, try our 30-day free trial to explore our incredible features.
You can also contact us through our support forums, support portal, or feedback portal. We are always happy to assist you!