We use cookies to give you the best experience on our website. If you continue to browse, then you agree to our privacy policy and cookie policy. Image for the cookie policy date

Different issues with grids and charts

Hi

After some struggle with implementing your components into my project (grids and charts), I encountered some problems I want to share with you. To make it easier to track, I will conclude everything in one post along with as much data as possible about each issue. Please note that I'm using version 18.1.44 (latest as of now).

1. After mouse hovering the pie slice and the tooltip disappears, the "hover" effect is still there. I expect it to go away when the mouse/tooltip go away.

2. While you are using the date format yyyy-MM-dd, I'm using quasar which expects YYYY-MM-DD. I posted about it in quasar forum and they say they are using the standard: https://www.iso.org/iso-8601-date-and-time-format.html so they are not going to change it. Maybe you can make your library work with YYYY-MM-DD as well?

3. This is how the sorting icon looks like when sorting a column. Inspecting the element shows a content of '\e234'. When viewing your samples here: https://ej2.syncfusion.com/vue/documentation/grid/columns/ where I do see up/down arrow accordingly, I see the content of  '\e840' . I'm using bootstrap.css.

4. How can I remove the border completely? There's a border property but it affects the surrounding of this border not that border specifically.

5. When I click on a slice in a pyramid chart, the "explode" effect works as expected but the whole chart looks disabled. It could have been a nice effect if at least the selected slice was "darker".

6. When clicking a legend item, the slice is not selected, the explode effect does not happen and pointClick event is not triggered.

7. The border question (point 4) applies here too but here my question is: how can I make the data labels black and "outside" (like in point 4 which is the default). The only difference is that this is StackingColumn chart.

8. queryCellInfo and addClass to the cell has no effect on the grid. It looks like it's working with version 17 but with 18.1.44 it's not.
<ejs-grid :dataSource="matrixData" height='100%' gridLines='Both' :allowSorting='true' :queryCellInfo='matrixColoring'>

    matrixColoring: function(args) {
        if (args.column.field == 'field1') {
            args.cell.classList.add('boldText');
        } else {
          if (this.matrixDataColoring[args.data['field1']][args.column.field] == 0)
            args.cell.classList.add('received');
          else if (this.matrixDataColoring[args.data['field1']][args.column.field] == 1)
            args.cell.classList.add('remain');
          else
            args.cell.classList.add('projected');
        }
    },

  .e-rowcell.boldText {
    font-weight: bold;
  }

  .e-rowcell.received {
    color#66DA26 !important;
  }

  .e-rowcell.remain {
    color#2E93fA !important;
  }

  .e-rowcell.projected {
    color#8b42f8 !important;
  }

I tried with .e-rowcell and without .e-rowcell but both failed, nothing affected the content of the cell.
I see the relevant classes in the html code (inspect tab in F12 panel) meaning the classes are added as expected
but the class css code does not affect the cell.

9. General question: You have default css styles like material, bootstrap and so on, how can I set my own style, for example,
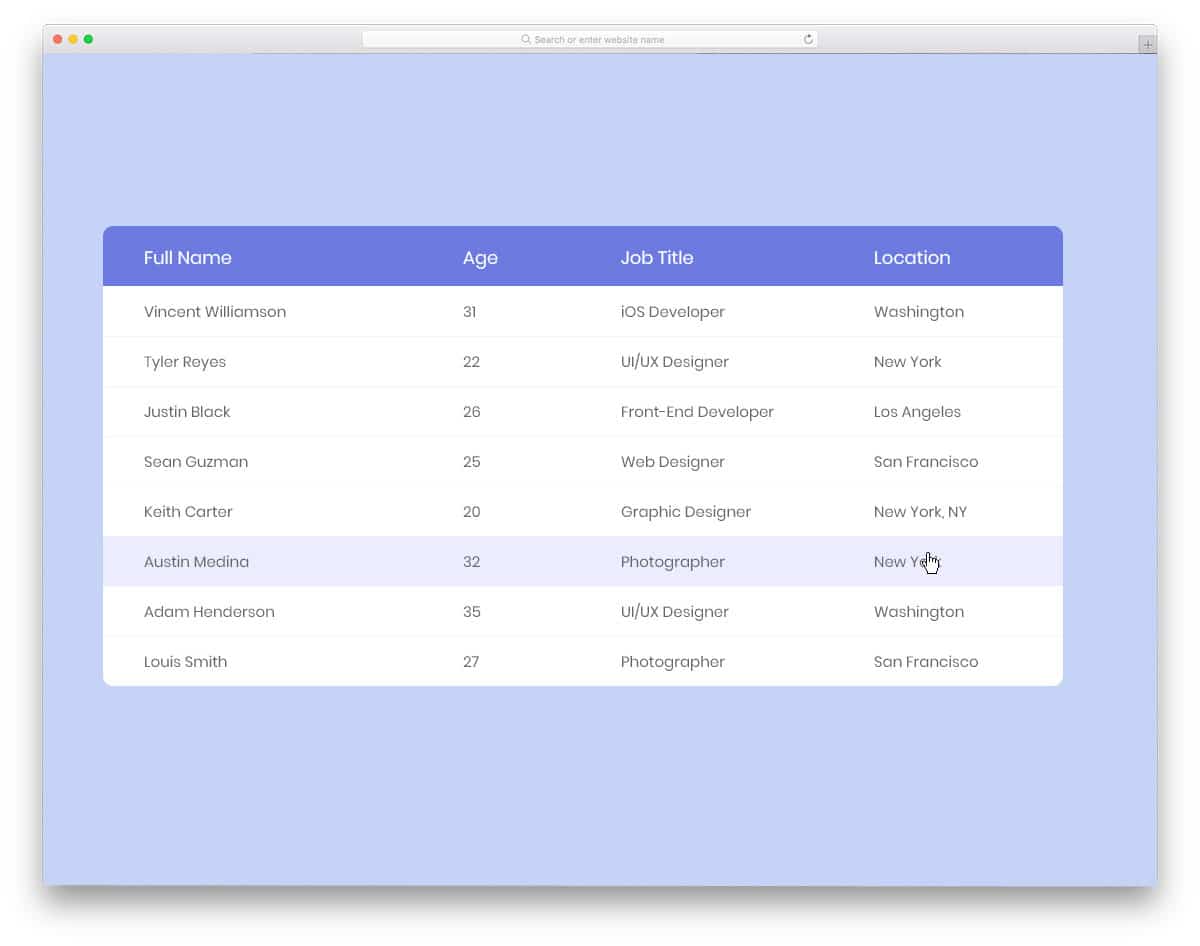
if I want the grid to look like the following:
10. Is it possible to set a gap for StackingColumn chart like you can do with the Pyramid chart?

Thanks a lot!

23 Replies

SK Sujith Kumar Rajkumar Syncfusion Team April 17, 2020 11:59 AM UTC

Hi Amos, 
 
Greetings from Syncfusion support. 
  
We have created a new incident under your Direct trac account to follow up with the queries related to Chart control(Query – 1, Query – 2, Query –4, Query – 5, Query – 6, Query – 7, Query – 10.). We suggest you to follow up with the incident for further updates. Please log in using the below link.  
  
  
You can find the remaining response for Grid queries below, 
 
Query – 1: “Sort icon not getting displayed” 
 
By default when sorting operation occurs in the column the sort icon will get displayed on the column header. For this you need not use add any custom styles but make sure you have imported the bootstrap theme file which contains the reference for the icons. 
 
<style> 
</style> 
 
 
This problem might also occur if the style file is not properly loaded due to slow internet so please ensure if the theme file is properly loaded in your application. 
 
Query – 2: “The queryCellInfo and addClass to the cell has no effect on the grid 
 
We were unable to reproduce the reported problem from our end with the updated packages(18.1.44) as the styles were properly applied with the code snippet you had provided. Please check below image for your reference, 


We suspect the problem might be occurring due to cached memory in the browser causing old grid settings to be restored. So we suggest you to clear the local cache, reinstall the Syncfusion packages after removing the old packages from the node modules and then run your application to see if this resolves the problem. 
 
We have prepared a local sample based on the above two queries for your reference which you can find below, 
 
 
Query – 3: You have default css styles like material, bootstrap and so on, how can I set my own style 
 
You can customize the styles for all the controls or particular controls and download the customized style file from the EJ2 Theme Studio. It can be accessed from the following link, 
 
 
Here you can filter the required controls for which you need to customize the styles from the filter tab. 


Then you can customize the accent and font colors here, 


After customization you can download the styles by using the download button and refer it in your application, 


Let us know if you have any concerns. 
 
Regards, 
Sujith R 


AM Amos April 19, 2020 09:24 PM UTC

1. Waiting for your check.

2. waiting for your check.

3. As you can see from the image, it does take it from bootstrap.css but the content number is different than the one in your docs '\e234' instead of '\e840'. The same happens with the re-order signs when re-ordering columns.


4. Waiting for your check.

5. I think a web meeting will help here, for some reason your demo works ok but on my project, it's not. I'm using Quasar framework and I think there's a collision.

6. I think a web meeting will help here, for some reason your demo works ok but on my project, it's not. I'm using Quasar framework and I think there's a collision.

7. Waiting for your check

8. Fixed! Problem was that the styles section was scoped.

9. Nice tool but I didn't find how to control the font itself, or the background color of the column's headers colors or make the edges rounded. Also, several options only had greyscale options. See my image as an example for coloring the column's headers.

10. Waiting for your check.

11. When setting a format='C2' to show a currency, a positive number is shown ok ($1.4) but a negative number is incorrect (-$1.4). The minus sign should be between the $ sign and the number itself.

12. How can I conditionally color the footer (sum, count etc..) cell of a grid? For the grid content there is queryCellInfo, is there something similar for the footer?

13. Is there an event when the grid finishes to parse its data and is now shown? dataBound event happens too early.

14. The column chooser button is above but is also shown below the grid and it looks weird. Not sure if related but I use auto fit for column causing the horizontal scrollbar to appear. Also, in the right most part of the columns header there is a "dead space" and below that, there is the scrollbar, I think it might be nice to put a small icon there to open the column chooser menu because now it occupy a full width for just one button.


15. If I do the following:
<e-column field='fieldname' type="boolean" headerText='bool' textAlign='center' displayAsCheckBox='true'/>
I see nothing in the cell, if I remove displayAsCheckBox property, I see true as expected. Am I missing something with showing a checkbox?


SK Sujith Kumar Rajkumar Syncfusion Team April 20, 2020 01:35 PM UTC

Hi Amos, 
 
Please follow the Chart related queries in the incident created under your direct-trac account. 
 
You can find the response for Grid queries below, 
 
Query – 1: As you can see from the image, it does take it from bootstrap.css but the content number is different than the one in your docs '\e234' instead of '\e840' 
 
This - '\e234' is the ascending sort icon content for bootstrap theme and '\e840' is set as icon content when the material theme is used. So the icon content is loaded properly only. 


We suspect you are loading the theme file from the node_modules folder and that either Syncfusion packages are not installed properly or duplicate packages might be installed causing the reported problem. So we suggest you to remove the @syncfusion packages from the node_modules folder and the package.lock.json file in your application and install the packages again to resolve the problem. Please refer to the below documentation link for package update.  
  
Documentation: https://ej2.syncfusion.com/vue/documentation/common/how-to/update-npm-package/  
 
Also clear the browser’s cached memory as the previous settings stored in the cache might also be getting restored causing the problem. 
 
If issue still persists please let us know how you have referred the style files in your application to validate further on this. 
 
Query – 2: Nice tool but I didn't find how to control the font itself, or the background color of the column's headers colors or make the edges rounded. 
 
If you need to further modify or customize the Grid appearance you can achieve it by overriding the default CSS of the Grid. The list of CSS classes that needs to be overridden for each area is explained in detail in the below help documentation site which you can refer for the style customization, 
 
 
Query – 3: When setting a format='C2' to show a currency, a positive number is shown ok ($1.4) but a negative number is incorrect (-$1.4). The minus sign should be between the $ sign and the number itself. 
 
We have forwarded your query to the concerned team. We update the further on or before 22nd April 2020. Until then we appreciate your patience. 
 
Query – 4: How can I conditionally color the footer (sum, count etc..) cell of a grid? For the grid content there is queryCellInfo, is there something similar for the footer? 
 
You can achieve this requirement by checking the aggregate value condition in the Grid’s dataBound event and based on that add a new class to the aggregate’s cell for styling it. This is demonstrated in the below code snippet, 
 
// Grid’s dataBound event function 
dataBound() { 
            // Aggregate module 
            var footerAggregate = this.$refs.gridObj.ej2Instances.aggregateModule.footerRenderer; 
            // Condition is checked with aggregate value which will be stored like – [“Column Field – aggregate type”] 
            if (footerAggregate.aggregates.aggregates["Freight - sum"] > 200) { 
                // Class is added to the aggregate cell 
                footerAggregate.contentTable.querySelectorAll('.e-templatecell')[0].classList.add('above-200'); 
            } 
            // Condition is checked with aggregate value which will be stored like – [“Column Field – aggregate type”] 
            if (footerAggregate.aggregates.aggregates["Freight - max"] < 150) { 
                // Class is added to the aggregate cell 
                footerAggregate.contentTable.querySelectorAll('.e-templatecell')[1].classList.add('below-150'); 
            } 
} 
 
<style> 
// Aggregate cell styles set based on added class 
.above-200 { 
    color: #8f8f1d !important; 
} 
 
.below-150 { 
    color: red !important; 
} 
</style> 
 
Sample for your reference, 
 
 
Query – 5:Is there an event when the grid finishes to parse its data and is now shown? dataBound event happens too early. 
 
The dataBound event will be triggered when all the data in the Grid is parsed and assigned to the data source, row elements created for them and are to be appended in the Grid. Please let us know what operation you wish to perform and based on that we will provide the further update. 
 
Query – 6: The column chooser button is above but is also shown below the grid and it looks weird. Not sure if related but I use auto fit for column causing the horizontal scrollbar to appear. Also, in the right most part of the columns header there is a "dead space" and below that, there is the scrollbar, I think it might be nice to put a small icon there to open the column chooser menu because now it occupy a full width for just one button. 
 
We suspect this problem is occurring due to the same problem causing the icon to not appear properly in the Grid. So please follow the steps mentioned in query – 1 and if the problem still persists please share us the following information to validate further on this, 
 
  • Video demonstration of the problem.
  • Grid code file.
 
Query – 7: “I see nothing in the cell, if I remove displayAsCheckBox property, I see true as expected. Am I missing something with showing a checkbox?” 
 
If your requirement is to just render checkbox then we suggest you to simply set type as ‘checkbox’ for the column and remove the field and displayAsCheckBox properties and define the column like below, 
 
<e-column type='checkbox' headerText='Bool' width=120></e-column> 
 
If your requirement is to bind to the field values to the checkbox then remove the type=’boolean’ from your code and define column like below, 
 
<e-column field='fieldname' headerText='bool' textAlign='center' displayAsCheckBox='true'></e-column> 
 
 
Let us know if you have any concerns. 
 
Regards, 
Sujith R  


SK Sujith Kumar Rajkumar Syncfusion Team April 21, 2020 06:43 AM UTC

Hi Amos, 
 
Thanks for your patience. 
 
Query: “When setting a format='C2' to show a currency, a positive number is shown ok ($1.4) but a negative number is incorrect (-$1.4). The minus sign should be between the $ sign and the number itself.” 
 
When loading the negative currency format to the component the negative sign should be placed before the symbol. This is the correct behavior of the currency format that is maintained by globalization.   
  
Please check the below screenshot, 


To know more about the currency formatting, please refer to the following documentation link - https://docs.microsoft.com/en-us/globalization/locale/currency-formatting   
 
Let us know if you have any concerns. 
 
Regards, 
Sujith R 


AM Amos April 21, 2020 09:39 PM UTC

Hi

Please allow me to maintain the general list so I will have it organize for my sake :)

1. Mouse hover a pie, selection effect does not go away after mouse move away: Waiting for it to be fixed. Not urgent.

2. date format: That's what I'm doing now. My request is whether you can support YYYY-MM-DD as well because this is the standard: https://www.iso.org/iso-8601-date-and-time-format.html for example: DD means the day of month in numbers (today is 21) while dd means day name (today is tu (as in Tuesday)).

3. sort up/down icons: I did what you told me and the problem is still there. Any idea how can I check whether this is a font issue? Can it be a font issue? please read here for more info: https://stackoverflow.com/questions/49754892/font-awesome-5-on-pseudo-elements-shows-square-instead-of-icon

4. remove border of chart: fixed!

5. selecting a slice in Pyramid causing the pyramid to look disabled: Once I removed selectionMode='Point' from "ejs-accumulationchart" it works as expected. fixed. Though selectionMode has a purpose and I wonder if there is a problem underneath.

6. legend item click does nothing: I meant when toggleVisiblity is false: totalsLegend: { visible: true, toggleVisibility: false }. This problem happens also after "fixing" point 5.

7. StackingColumns labels:
a. Can you please add it as a request to put datalaels outside? This feature exists in other chart types. I also tried using margins but that didn't change anything.
b. color font: fixed.

8. changing classes to specific cells in grid: fixed.

9. customize the look of a grid: thanks, will try it. fixed.

10. gap stacking column: your trick works nicely. I hope in the future you will add such feature like you have with the Pyramid. Can I ask this as a feature request?

11. minus sign before the currency sign: fair enough :) . fixed.

12. conditonally color footer: your solution works but
a. How can I know the index of the relevant field I'm checking? I want to color that field's footer (even if it is moved). In your example it's 0 (for example): footerAggregate.contentTable.querySelectorAll('.e-templatecell')[0].classList.add('valDown');
b. It would be nice to have this feature added, like when coloring the grid cell. It's more intuitive.

13. Event when the grid is with data: dataBound happens too early: You wrote: The dataBound event will be triggered when all the data in the Grid is parsed and assigned to the data source, row elements created for them and are to be appended in the Grid.
I have a grid with 800+ rows (and they can be with more than that), also the cells are added with classes to be colored depends on a condition. It seems there is a gap between "...and are to be appended in the Grid" and actually seeing the data on screen. I put a "please wait..." popup but it goes away early and the grid is still "empty", it sometimes takes a few more seconds until it is shown with data. for now I use paging.

14. I did what you wrote (see point 3) and the problem continues. I think the other problem is font related. I don't know what is causing this one. Here is the code


      filterOptions: {
        type: 'Menu'
      },      
freezeCols: 1,

    gridColoring: function(args) {
      args.cell.classList.add('cell');
      if (args.column.field == 'symbol') {
        args.cell.classList.add('boldText');
      } else if (args.column.field == 'changePercent') {
        if (args.data["changePercent"] < 0) {
          args.cell.classList.add('valDown')
        } else if (args.data["changePercent"] > 0) {
          args.cell.classList.add('valUp')
        }
      }
    },    
      toolbarOptions: ['ColumnChooser'],
    dataBound: function() {
        this.$refs.grid.autoFitColumns([]);
    },

import { GridPlugin, Sort,Aggregate, Resize, Reorder,ColumnChooser,Toolbar,Freeze } from '@syncfusion/ej2-vue-grids';
provide: {
    grid: [Sort, Aggregate, Resize, Reorder,ColumnChooser,Toolbar, Freeze]
  },

15. checkbox column: I want it to be based on a field so I did the following which is just removing the type="boolean" part : but unfortunately, the checkbox is still not there. Anything else I should do to support this checkbox? Maybe it's another font issue? Do you show there a /e.... character?

16. filtering grid: I see the (strange) icon but clicking on it, does nothing. Here is the code

      filterOptions: {
        type: 'Menu'
      },     


SK Sujith Kumar Rajkumar Syncfusion Team April 22, 2020 01:40 PM UTC

Hi Amos, 
 
No problem you can maintain the list of queries. 
 
Grid queries response: 
 
Query – 3: I did what you told me and the problem is still there. Any idea how can I check whether this is a font issue? Can it be a font issue? 
Query – 16: “Filtering - I see the (strange) icon but clicking on it, does nothing. 
 
The issue that you have mentioned occurs while specifying the icons in the sample-level. Since these icons(Sort, Filter) are integrated in our source-level you need not import any other files to display them. Could you let us now how you have referred the Syncfusion style files in your application as requested previously to further validate on this. 
 
Query – 8, Query – 9, Query – 11: 
 
We are glad to hear that these queries have been resolved for you. 
 
Query – 12: How can I know the index of the relevant field I'm checking? 
 
You can set custom class to the aggregate’s footerTemplate function and based on that class apply the required styles to the cells. This is demonstrated in the below code snippet, 
 
<ejs-grid :dataSource="data" ref='gridObj' :dataBound='dataBound' :allowPaging="true" :queryCellInfo='matrixColoring' :allowSorting="true" :pageSettings='pageSettings'> 
        <e-aggregates> 
            <e-aggregate> 
                <e-columns> 
                    <e-column type="Sum" field="Freight" :footerTemplate='footerSum'></e-column> 
                </e-columns> 
            </e-aggregate> 
            <e-aggregate> 
                <e-columns> 
                    <e-column type="Max" field="Freight" :footerTemplate='footerMax'></e-column> 
                </e-columns> 
            </e-aggregate> 
        </e-aggregates> 
</ejs-grid> 
 
export default { 
        name: 'app', 
        data() { 
            return { 
                footerSum: function () { 
                    return { 
                        template: Vue.component('sumTemplate', { 
                            template: `<span class='sum-aggregate'>Sum: {{data.Sum}}</span>`, 
                            data() { return { data: {} }; } 
                        }) 
                    } 
                }, 
                footerMax: function () { 
                    return { 
                        template: Vue.component('maxTemplate', { 
                            template: `<span class='max-aggregate'>Max: {{data.Max}}</span>`, 
                            data() { return { data: {} }; } 
                        }) 
                    } 
                } 
            }; 
        }, 
        methods: { 
            dataBound() { 
               var footerAggregate = this.$refs.gridObj.ej2Instances.aggregateModule.footerRenderer; 
               if (footerAggregate.aggregates.aggregates["Freight - sum"] > 200) { 
                   footerAggregate.contentTable.querySelector('.sum-aggregate').closest('.e-templatecell').classList.add('above-200'); 
               } 
               if (footerAggregate.aggregates.aggregates["Freight - max"] < 150) { 
                   footerAggregate.contentTable.querySelector('.max-aggregate').closest('.e-templatecell').classList.add('below-150'); 
               } 
            } 
        }, 
        provide: { 
            grid: [Aggregate, Page, Sort] 
        } 
    } 
 
Query – 13:I have a grid with 800+ rows (and they can be with more than that), also the cells are added with classes to be colored depends on a condition 
 
You can use the queryCellInfo event(Triggered before each cell is appended to the row element) which will return each cell element in its arguments. Here you can check your condition and color the cells as per your requirement. 
 
 
Query – 14: I did what you wrote (see point 3) and the problem continues. I think the other problem is font related. 
 
We are not able to understand this query properly so can you please elaborate on this. 
 
Query – 15: I want it to be based on a field so I did the following which is just removing the type="boolean" part : but unfortunately, the checkbox is still not there. Anything else I should do to support this checkbox? Maybe it's another font issue? Do you show there a /e.... character? 
 
We have rendered a checkbox column for your reference in the sample provided below. Please ensure if the column and data field bound in your application are proper as in the sample. We have also included the changes for the previous queries in this sample so that you can refer it. You can find the sample below, 
 
 
If checkbox column is still not rendered we suspect it might be due to the same issues as for Query – 3 and 16. If so we will provide response for this based on the details provided for those queries. 
 
Let us know if you have any concerns. 
 
Regards, 
Sujith R 


AM Amos April 23, 2020 08:03 AM UTC

2. date format: when a user is selecting his date format, I wanted to use one format, for example YYYY-MM-DD. While other components I use require YYYY-MM-DD you require yyyy-MM-dd and that means to keep 2 syntaxes for the same format. I was hoping that maybe you could also add support for Y (uppercase) for year and D (uppercase) for day of month.

3. FIXED! I needed to import 2 css files, not just one. Now it shows all the icons.
@import "../../node_modules/@syncfusion/ej2-base/styles/bootstrap4.css";
@import "../../node_modules/@syncfusion/ej2-vue-grids/styles/bootstrap4.css";

6. After removing "selectionMode='Point'" from the accumulation chart section, and setting totalsLegend: { visible: true, toggleVisibility: false }, when clicking a legend item, nothing happend. I understand that this is the expected behavior? I thought it should select the relevant slice of the pie.

7. StackingColumns labels outside: see the following image. The right chart looks great. the left chart behaves the following:
the second column has 3 parts. The lowest one is too small so the datalabel is outer (great!) the second part is top/inside and the top part is also top/inside. It would look great if all 3 were outer. Is it ok to ask you to allow this option and the user will decide which option is better for him? What do you think?


12. conditional footer: I added the following template: '{{data.Sum}}', but I have 4 fields with sum and I need to color only 2 of them, now it colorize only one based on the .querySelector('.sum-aggregate').closest('.e-templatecell'). which is not my field. Is there a better way to pinpoint the specific field I'm in? I can ofcourse create 4 templates for the 4 fields but I wonder if there is something cleaner. Also, can this be added as a feature request to be more user friendly, like the cell coloring?

13. You answered to the wrong question :) My problem is the following:  dataBound event is triggered when all the data in the Grid is parsed and assigned to the data source, row elements created for them and are to be appended in the Grid.
My problem is that there is a gap between this step and actually seeing the data on screen. My question is whether there is an event for when the data is already on the screen.

14. Fixed, after importing ALL css related files and not just the grid itself, everything looks magnificent!

15. Fixed, after importing ALL css related files and not just the grid itself, everything looks magnificent!

16. Fixed, after importing ALL css related files and not just the grid itself, everything looks magnificent!

17. When double clicking a column's header border to autosize it, if there are both filter and sort icons, the automatic new width is good enough for the filter icon but the sort icon appears on the column title.

18. Exporting to excel when there's a custom aggregation, the export fails.

More info: I have the following agg defined as explained in the docs. Notice that the aggregate is on column Y but it actually aggregates field X
<e-column type="Custom" columnName="Y" format='C2'  :customAggregate="cpAggregate" >e-column>

    cpAggregate: function () {
      var res = 0;
      for (var item in this.gridData) {
        res += this.gridData[item].X;
      }
      return "$" + Math.round(res * 100) / 100;
    },

If I export to excel this way, I get the following error
excel-export.js?6e1f:603 Uncaught (in promise) TypeError: Cannot convert undefined or null to object
    at Function.keys ()
    at ExcelExport.fillAggregates (excel-export.js?6e1f:603)
    at ExcelExport.processAggregates (excel-export.js?6e1f:571)
    at ExcelExport.processRecordContent (excel-export.js?6e1f:351)
    at ExcelExport.processGridExport (excel-export.js?6e1f:326)
    at eval (excel-export.js?6e1f:221)
    at new Promise ()
    at ExcelExport.processInnerRecords (excel-export.js?6e1f:219)
    at eval (excel-export.js?6e1f:148)

The line itself is for (var _c = 0, _d = Object.keys(row.data[cell.column.field]); _c < _d.length; _c++) { <<< cell.column.field is null here obviously.
So I added a field to the definition. field same as columnName = Y
<e-column type="Custom" field="Y" columnName="Y" format='C2'  :customAggregate="cpAggregate" >e-column>
In this case, export is working but the aggregation isn't, it shows NAN
So I change the field to be X as the one we actually aggregate
<e-column type="Custom" field="X" columnName="Y" format='C2'  :customAggregate="cpAggregate" >e-column>
In this case the aggregate is working again but this time, the export is throwing a different error. Notice that X is not part of the grid, it is just part of the data

Uncaught (in promise) TypeError: Cannot convert undefined or null to object
    at Function.keys ()
    at ExcelExport.fillAggregates (webpack-internal:///./node_modules/@syncfusion/ej2-grids/src/grid/actions/excel-export.js:614)
    at ExcelExport.processAggregates (webpack-internal:///./node_modules/@syncfusion/ej2-grids/src/grid/actions/excel-export.js:582)
    at ExcelExport.processRecordContent (webpack-internal:///./node_modules/@syncfusion/ej2-grids/src/grid/actions/excel-export.js:362)
    at ExcelExport.processGridExport (webpack-internal:///./node_modules/@syncfusion/ej2-grids/src/grid/actions/excel-export.js:337)
    at eval (webpack-internal:///./node_modules/@syncfusion/ej2-grids/src/grid/actions/excel-export.js:232)
    at new Promise ()
    at ExcelExport.processInnerRecords (webpack-internal:///./node_modules/@syncfusion/ej2-grids/src/grid/actions/excel-export.js:230)
    at eval (webpack-internal:///./node_modules/@syncfusion/ej2-grids/src/grid/actions/excel-export.js:159)


SK Sujith Kumar Rajkumar Syncfusion Team April 23, 2020 12:25 PM UTC

Hi Amos, 
 
Query – 3, Query – 14, Query – 15, Query – 16:  
 
We are glad to hear that these queries are resolved. 
 
Query – 12: Conditional footer 
 
This is the way to differentiate and color the aggregate cells. Another way would be to compare the aggregate results with the element value but it would not look so good. So we suggest you to define two sum aggregate templates – One for two columns that need to be colored and the other two for the ones without colors. Then add the class to the template that needs to be colored based on which you can customize the aggregate cell. 
 
As for your feature request for cell coloring, since this can be achieved for most of the elements rendered in the Grid by overriding the default CSS properties as documented in this link we have not logged any separate feature for it. 
 
Query – 13: My problem is that there is a gap between this step and actually seeing the data on screen. My question is whether there is an event for when the data is already on the screen. 
 
As explained previously the dataBound event will be triggered when the data is parsed and to be assigned to the Grid as row elements. However since your requirement is to color the cells you would need to access the Grid’s row or cell element and add custom classes to them for achieving it. That is why we suggested you to use the queryCellInfo event that returns each cell element with the column field and value details in its arguments based on which you can customize the cell styles. You can also use the rowDataBound event which is just like the queryCellInfo but returns the row elements that are going to be appended in the Grid with the column details. The data you see on screen can be accessed in these events for customizing the elements since your requirement is to perform the same operation in the event you requested. 
 
 
Query – 17: When double clicking a column's header border to autosize it, if there are both filter and sort icons, the automatic new width is good enough for the filter icon but the sort icon appears on the column title. 
 
Could you please share us a pictorial or video demonstration of the problem since we are not able to properly identify it from your query. 
 
Query – 18: Exporting to excel when there's a custom aggregation, the export fails. 
 
The exporting will work fine for custom aggregates by using the following code for your scenario, 
 
<e-column type="Custom" columnName="Y" format='C2'  :customAggregate="cpAggregate" ></e-column> 
 
We suspect the problem might be occurring because you have not specified the closing aggregate column tag properly for which you have mentioned in your code like – “e-column>. So please specify the tags properly to render the aggregates without any problems. 
 
Updated sample based on the above query for your reference, 
 
 
Let us know if you have any concerns. 
 
Regards, 
Sujith R 


AM Amos April 23, 2020 04:12 PM UTC

12. conditional footer: you wrote "As for your feature request for cell coloring, since this can be achieved for most of the elements rendered in the Grid by overriding the default CSS properties as documented in this link we have not logged any separate feature for it."

You can also do this for a cell and still you have :queryCellInfo to add different classes to the cell. The feature request would be to have a similar queryCellInfo also to aggregate cells in the footer.

13. I was unclear so I will explain again from the beginning: Ignore what I wrote about customizing cells, it's confusing.
I have a grid with 900 rows (for example). When the page opens up, I send a request to my server, gets a response and show it in the grid.
Before making the request I show a popup with "please wait..." so the user will know that something is happening.
When the response comes back, I assign the data to the grid and in dataBound event I hide the "please wait..." popup.
The problem is that the popup is hidden too early because the grid still needs more time to actually show the data itself.
My question/request: Is there an event that is triggered when the data is shown on the grid so I can hide the "please wait" popup only when that happens.

17. Here is an image to show the issue

18. It was an error when pasting the code, if there was such an error, my project would fail to start at all. So again, this time pasting correctly.
<e-column type="Custom" columnName="Y" format='C2'  :customAggregate="cpAggregate" >

cpAggregate: function () {
      var res = 0;
      for (var item in this.gridData) {
        res += this.gridData[item].X;
      }
      return "$" + Math.round(res * 100) / 100;
    },

The error

excel-export.js?6e1f:603 Uncaught (in promise) TypeError: Cannot convert undefined or null to object
    at Function.keys ()
    at ExcelExport.fillAggregates (excel-export.js?6e1f:603) <<<<<<<<<<<<<<<<<<<<< see below the error line itself
    at ExcelExport.processAggregates (excel-export.js?6e1f:571)
    at ExcelExport.processRecordContent (excel-export.js?6e1f:351)
    at ExcelExport.processGridExport (excel-export.js?6e1f:326)
    at eval (excel-export.js?6e1f:221)
    at new Promise ()
    at ExcelExport.processInnerRecords (excel-export.js?6e1f:219)
    at eval (excel-export.js?6e1f:148)

The line itself is for (var _c = 0, _d = Object.keys(row.data[cell.column.field]); _c < _d.length; _c++) { <<< cell.column.field is null here because there is columnName and not field in the aggregate definition. Not sure if relevant but the aggregate is done on a field that is not in the grid, only in the data. Maybe that confuses the grid when exporting.

As you can see, field is undefined because it's not defined
<e-column type="Custom" columnName="Y" format='C2'  :customAggregate="cpAggregate" >


SK Sujith Kumar Rajkumar Syncfusion Team April 24, 2020 10:47 AM UTC

Hi Amos, 
 
Query – 12: You can also do this for a cell and still you have :queryCellInfo to add different classes to the cell. The feature request would be to have a similar queryCellInfo also to aggregate cells in the footer. 
 
The queryCellInfo event returns each cell before appending to the row element but the same cannot be returned for the aggregate cell as this value is calculated finally and directly appended to the ‘tr’ element. Since your requirement is to customize the aggregate cell without having to define separate template properties for them, you can achieve it by using their mapping-id which is the corresponding column’s id mapped to its aggregate cell to differentiate them and customize. This is demonstrated in the below code snippet, 
 
dataBound() { 
        var footerAggregate = this.$refs.gridObj.ej2Instances.aggregateModule.footerRenderer; 
        var aggregateCells = []; 
        // The template cell element of the aggregate cells are returned from the custom-class added to them through footer template 
        footerAggregate.contentTable.querySelectorAll('.sum-aggregate').forEach(x => aggregateCells.push(x.closest('.e-templatecell'))); 
        // The id’s of the required column are retrieved using their field names 
        var col1ID = this.$refs.gridObj.getColumnByField('Freight1').uid; 
        var col3ID = this.$refs.gridObj.getColumnByField('Freight3').uid; 
        var colorAggregates = []; 
        // The template cell’s ‘e-mappinguid’ is compared with the column’s id and based on that the cell can be customized 
        aggregateCells.forEach(x => (x.getAttribute('e-mappinguid') === col1ID || x.getAttribute('e-mappinguid') === col3ID) ? x.classList.add('custom-cell-color') : []) 
} 
 
Query – 13: Is there an event that is triggered when the data is shown on the grid so I can hide the "please wait" popup only when that happens. 
 
The dataBound event is the final event that is triggered from the Grid during initialization. Since you have large amount of data to be appended to the Grid it will take some time to be rendered. So if you need to show the popup for particular amount of time then we suggest you to hide the popup using a timeout function in the dataBound event. 
 
Query – 17: When double clicking a column's header border to autosize it, if there are both filter and sort icons, the automatic new width is good enough for the filter icon but the sort icon appears on the column title. 
 
We could reproduce this problem with your application settings. It was occurring since the style files needed for the Grid component was not imported correctly. The below style files need to be imported in the application for the Grid operations to work properly, 
 
<style> 
@import '../../node_modules/@syncfusion/ej2-base/styles/bootstrap4.css'; 
@import '../../node_modules/@syncfusion/ej2-buttons/styles/bootstrap4.css'; 
@import '../../node_modules/@syncfusion/ej2-calendars/styles/bootstrap4.css'; 
@import '../../node_modules/@syncfusion/ej2-dropdowns/styles/bootstrap4.css'; 
@import '../../node_modules/@syncfusion/ej2-inputs/styles/bootstrap4.css'; 
@import '../../node_modules/@syncfusion/ej2-navigations/styles/bootstrap4.css'; 
@import '../../node_modules/@syncfusion/ej2-popups/styles/bootstrap4.css'; 
@import '../../node_modules/@syncfusion/ej2-splitbuttons/styles/bootstrap4.css'; 
@import "../../node_modules/@syncfusion/ej2-vue-grids/styles/bootstrap4.css"; 
</style> 
 
Importing the above style files will resolve this problem. 
 
Query – 18: “Excel export error with aggregates” 
 
It is not necessary to only use the fields defined in the Grid column for calculating the custom aggregate value. The columnName or field determines which column to place the aggregate cell so it is only required that the column specified in this property to be present in the Grid columns. You can define the column like below itself, 
 
<e-column type="Custom" field="Y" columnName="Y" format='C2' :customAggregate="cpAggregate"><e-column> 
 
We suspect you are using older Syncfusion package since the mentioned condition is not checked in this scenario in the latest packages. So we suggest you to remove the @syncfusion packages from the node modules and then update the Syncfusion package to the latest version to see if this resolves the problem.  
 
 
If issue still persists please share us the entire Grid related code file to validate further. 
 
Modified sample based on the above queries for your reference, 
 
 
Let us know if you have any concerns. 
 
Regards, 
Sujith R 


AM Amos April 25, 2020 02:09 PM UTC

12. Eventually I went with your other idea and created different footer sum templates per cell to color.

13. ok.

17.  I already have it your way and still this problem occurs. You wrote "with your application settings" - what do you mean by that?

  @import "../../node_modules/@syncfusion/ej2-base/styles/bootstrap4.css";
  @import '../../node_modules/@syncfusion/ej2-buttons/styles/bootstrap4.css';  
  @import '../../node_modules/@syncfusion/ej2-calendars/styles/bootstrap4.css';  
  @import '../../node_modules/@syncfusion/ej2-dropdowns/styles/bootstrap4.css';  
  @import '../../node_modules/@syncfusion/ej2-inputs/styles/bootstrap4.css';  
  @import '../../node_modules/@syncfusion/ej2-navigations/styles/bootstrap4.css';
  @import '../../node_modules/@syncfusion/ej2-popups/styles/bootstrap4.css';
  @import '../../node_modules/@syncfusion/ej2-splitbuttons/styles/bootstrap4.css';
  @import "../../node_modules/@syncfusion/ej2-vue-grids/styles/bootstrap4.css";


18. After looking in the code

                        if (!isNullOrUndefined(cell.column.footerTemplate)) { < other aggregators go to this condition. Custom does not have footerTemplate
                            eCell.value = this.getAggreateValue(CellType.Summary, cell.column.footerTemplate, cell, row);
                        }
                        else if (!isNullOrUndefined(cell.column.groupFooterTemplate)) {
                            eCell.value = this.getAggreateValue(CellType.GroupSummary, cell.column.groupFooterTemplate, cell, row);
                        }
                        else if (!isNullOrUndefined(cell.column.groupCaptionTemplate)) {
                            eCell.value = this.getAggreateValue(CellType.CaptionSummary, cell.column.groupCaptionTemplate, cell, row);
                        }
                        else { <<<< so it goes here and fail because it also don't have a field.
                            for (var _c = 0, _d = Object.keys(row.data[cell.column.field]); _c < _d.length; _c++) {

I added field AND footerTemplate to the custom agg and now it's ok, including export to excel.
BUT, the coloring isn't working. See below image
While other aggs have values, the custom agg does not. what am I missing?
      footerCustom: function () {
        return  {
          template : Vue.component('Custom', { << I tried Custom and footerCustom but both had the same result = null
            template: '{{data.Custom}}',
            data () {return { data: {}};}
          })
        }
      },     


19. freeze column generate a gap as we scroll down the grid


ejs-grid :frozenColumns='freezeCols'

freezeCols: 1,


SK Sujith Kumar Rajkumar Syncfusion Team April 27, 2020 11:45 AM UTC

Hi Amos, 
 
Query – 17: I already have it your way and still this problem occurs. You wrote "with your application settings" - what do you mean by that? 
 
By application settings we meant you had previously mentioned referring the below style files in your application, 
 
@import '../../node_modules/@syncfusion/ej2-base/styles/bootstrap4.css'; 
@import "../../node_modules/@syncfusion/ej2-vue-grids/styles/bootstrap4.css";  
 
But for the Grid to work properly you need to import all its dependent controls styles as mentioned in our previous update.  
 
If problem still persists it might be occurring due to cached memory in the browser causing old settings to be restored. So as mentioned in our previous update, we suggest you to clear the local cache, reinstall the Syncfusion packages after removing the old packages from the node modules and then run your application to see if this resolves the problem. 
 
Also please ensure if all the packages mentioned are available in the node_modules folder to import the styles. 
 
Query – 18: “I added field AND footerTemplate to the custom agg and now it's ok, including export to excel. BUT, the coloring isn't working 
 
As the custom aggregate value is calculated in application-level it may include calculations from other variables defined in the application. Since it will not be feasible to keep recalculating and updating this custom value in the source each time a variable change occurs, the custom aggregate value is not stored. So we suggest you to color the custom-aggregate cell using its inner text value as demonstrated in the below code snippet, 
 
export default { 
        name: 'app', 
        data() { 
            return { 
                  . 
                  . 
                footerTemp: function () { 
                    return { 
                        template: Vue.component('footerTemplate', { 
                            template: `<span class='custom-aggregate'>{{data.Custom}}</span>`, 
                            data() { return { data: {} }; } 
                        }) 
                    } 
                } 
            }; 
        }, 
        methods: { 
                . 
                . 
            dataBound() { 
                var footerAggregate = this.$refs.gridObj.ej2Instances.aggregateModule.footerRenderer; 
                var customAggregate = footerAggregate.contentTable.querySelector('.custom-aggregate'); 
                if (customAggregate) { 
                    var customAggregateVal = customAggregate.innerText; 
                    (Number(customAggregateVal) > 200) ? customAggregate.classList.add('custom-cell-color') : []; 
                } 
            } 
        }, 
  
Query – 19: “freeze column generate a gap as we scroll down the grid 
 
Before proceeding with this query could you share us the following information to validate further on this, 
 
  • Video demonstration of the problem to understand it clearly.
  • How many rows are displayed in the Grid in a single page?
  • Have you enabled virtualization in the Grid?
 
Let us know if you have any concerns. 
 
Regards, 
Sujith R 


AM Amos April 27, 2020 01:05 PM UTC

17. This is not critical but as I wrote in the past for other points, cache and refresh are not an issue here. I already updated to your latest packages after removing the old packages. Also I added all the relevant css files to the import list of the style section. After doing so, the visuality is great. The only thing is when double clicking a column header border to autosize the column and there are both sort and filter icons. See following image, the column header and icons are ok. Now I double click the header border to autosize the years column. Result: While the filter icon is located after the column header (ok), the sort icon is located on the header text (not ok). Meaning the result of the auto size does not consider the sort icon in its calculations.
18. fixed, thanks

19. freeze cols issue
1. This image explains the scenario, as you scroll down, the freeze column is "separated" from the rest of the row

2. There are 100 rows in one page but as you can see from the image above, the separation begins with the second row.
3. I didn't enabled virtualization in the grid. If the default is NO virtualization then I don't have virtualization.

Thanks


AM Amos April 28, 2020 09:40 AM UTC

19. It happens ONLY on Firefox, in Chrome it's ok. notice the height difference between the cells of a regular column and a freezed column


SK Sujith Kumar Rajkumar Syncfusion Team April 28, 2020 12:42 PM UTC

Hi Amos, 
 
Query – 17: This is not critical but as I wrote in the past for other points, cache and refresh are not an issue here. I already updated to your latest packages after removing the old packages. Also I added all the relevant css files to the import list of the style section.” 
 
We had suggested you to do this since we could also reproduce the same problem when not importing the required styles so we suspected it might due to missing/old packages. Instead of the imported style files, could you try referencing the below online style file and let us know if this resolves the problem. 
 
<style>  
</style>  
 
Also if you have used Grid component in different pages, please make sure to import the styles in all these pages so that they are referenced there. 
 
Query – 19: freeze cols issue 
 
While using frozen rows and columns, the height and width must be set to the Grid and we suspect this is causing the misalignment problem in the Grid. So please ensure to set the required height and width to the Grid using its height and width properties respectively to resolve this problem. If problem still persists please share us your updated Grid code file to further validate this. 


Updated sample for your reference, 
 
 
Let us know if you have any concerns. 
 
Regards, 
Sujith R 


AM Amos April 28, 2020 01:09 PM UTC

17. Linking to the online file made everything a mess
When I set it back to this
  @import "../../node_modules/@syncfusion/ej2-base/styles/bootstrap4.css";
  @import '../../node_modules/@syncfusion/ej2-buttons/styles/bootstrap4.css';  
  @import '../../node_modules/@syncfusion/ej2-calendars/styles/bootstrap4.css';  
  @import '../../node_modules/@syncfusion/ej2-dropdowns/styles/bootstrap4.css';  
  @import '../../node_modules/@syncfusion/ej2-inputs/styles/bootstrap4.css';  
  @import '../../node_modules/@syncfusion/ej2-navigations/styles/bootstrap4.css';
  @import '../../node_modules/@syncfusion/ej2-popups/styles/bootstrap4.css';
  @import '../../node_modules/@syncfusion/ej2-splitbuttons/styles/bootstrap4.css';
  @import "../../node_modules/@syncfusion/ej2-vue-grids/styles/bootstrap4.css";
it worked again with no problem except for the auto size problem I mentioned.

19. I have the following grid code:
      <div class="q-pa-md" style='height: 85vh'>
        <ejs-grid id='Grid' :toolbarClick='toolbarClick' :allowExcelExport='true' :allowPaging="true" :pageSettings='pageSettings'
:allowFiltering='true' :filterSettings='filterOptions' :frozenColumns='freezeCols' :queryCellInfo='gridColoring'
:toolbar='toolbarOptions' :showColumnChooser='true' ref='gridObj' :allowReordering='true' :allowResizing='true'
:dataBound='dataBound' :dataSource="scrData" height='100%' gridLines='Both' :allowSorting='true'
:sortSettings='defaultSort'>

      freezeCols: 1,
There is height in the div that surrounds the grid and height is 100%.
Just so it won't be missed: In Chrome it works perfectly as it is now. The problem is only with Firefox.


SK Sujith Kumar Rajkumar Syncfusion Team April 29, 2020 11:38 AM UTC

Hi Amos, 
 
Thanks for the information. 
 
We could reproduce your reported issues – “Sort icons not displayed properly after column auto-fit” and “Grid lines mismatched while scrolling with frozen columns in Firefox” and have logged bug reports for the same. At Syncfusion, we are committed to fixing all validated defects (subject to technological feasibility and Product Development Life Cycle ) and will include the defect fix in our patch release which is scheduled to roll out on May 13th 2020.  
 
You can now track the current status of your requests, review the proposed resolution timeline, and contact us for any further inquiries through the following links.   
 
 
Let us know if you have any concerns.  
 
Regards, 
Sujith R 


AM Amos April 29, 2020 12:13 PM UTC

Thank you very much for a great support and a great set of components :)


SK Sujith Kumar Rajkumar Syncfusion Team April 30, 2020 05:38 AM UTC

Hi Amos, 
 
Thanks for the appreciation, we are glad that you are happy with our controls. 
 
Please get back to us if you require any further assistance. 
 
Regards, 
Sujith R 


SK Sujith Kumar Rajkumar Syncfusion Team May 14, 2020 10:47 AM UTC

Hi Amos, 
 
Sorry for the inconvenience. Due to our Volume 1 SP1 release we were unable to include the fixes in the mentioned timeline. We will include it in our upcoming patch scheduled on 20th May 2020.  
 
Until then your patience is appreciated. 
 
Regards, 
Sujith R 


SK Sujith Kumar Rajkumar Syncfusion Team May 20, 2020 11:12 AM UTC

Hi Amos, 
 
We are glad to announce that our Essential Javascript2 patch release (v18.1.53) has been rolled out successfully and in that release we have added the fix for the issues “Sort icons not displayed properly after column auto-fit” and Grid lines mismatched while scrolling with frozen columns in Firefox. So please update your package to this version to include the fix. 
 
We thank you for your support and appreciate your patience in waiting for this release. Please get in touch with us if you would require any further assistance. 
 
Regards, 
Sujith R 


AM Amos May 20, 2020 12:12 PM UTC

Hi

Firefox issue with frozen columns is fixed.
sort icon issue is partially fixed, it's much better than before but still a bit off.

thanks


SK Sujith Kumar Rajkumar Syncfusion Team May 21, 2020 09:33 AM UTC

Hi Amos, 

Thanks for the update. 

We checked from our end with the latest source but the reported issue was fixed. Please check below image of sort icon in auto-fitted columns, 


Updated sample for your reference, 


We suspect the problem might be occurring due to cached memory in the browser causing old settings to be restored. So we suggest you to clear the local cache and then run your application to see if this resolves the problem. 

If problem still persists can you please share us the following details as previously requested in forum – 154358 so that we can check and provide you the proper solution, 

  • Share the package.json file of your angular application and the one that is present inside the node_modules/@syncfusion/ej2-grids folder of the angular application.
  • Grid code file.
  • If possible provide us a simple sample to replicate problem or try reproducing it in the above provided sample.

Let us know if you have any concerns. 

Regards, 
Sujith R 


Loader.
Up arrow icon