.NET MAUI Cartesian Charts - Beautiful and Interactive
- 35+ chart types in a growing collection.
- Intuitive APIs with detailed documentation.
- A rich, interactive feature set for exploring charts.
Trusted by the world’s leading companies

Why choose the Syncfusion® .NET MAUI Cartesian Charts control?
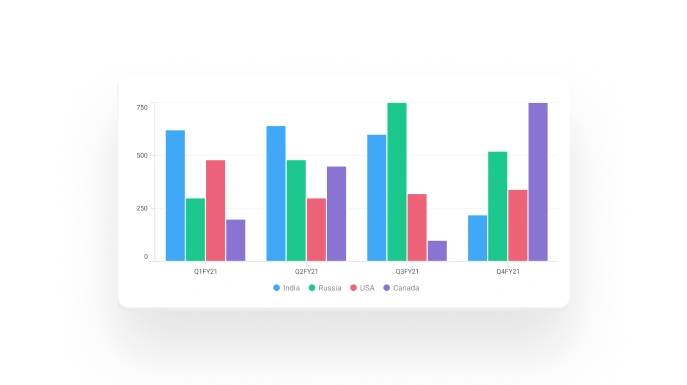
The .NET MAUI Cartesian Charts is a well-crafted charting control for visualizing data. It contains a rich gallery of 35+ charts and graphs that cater to all charting scenarios.
35+ charts
Includes popular and widely used charts like line, column, bar, area, and scatter.
Rich feature set
A wide range of features are available to customize the appearance of charts and render the needed outputs.
AI-Assisted Development
Build interactive data visualization experiences faster with the AI Coding Assistant and Syncfusion Agent Skills. Generate chart layouts, configure series and axes, and create analytical dashboards with minimal manual effort.
Export
The .NET MAUI Cartesian Charts can be exported to image formats like JPEG and PNG.
Chart types
Cartesian Charts include functionality for plotting 35+ charts. Each chart is easily configured with built-in support for creating stunning visual effects.


Chart axis
The .NET MAUI Cartesian Charts component supports five types of axes: numeric, categoric, date-time, date-time categoric, and logarithmic. The appearance of all chart axis elements can be customized with built-in properties.
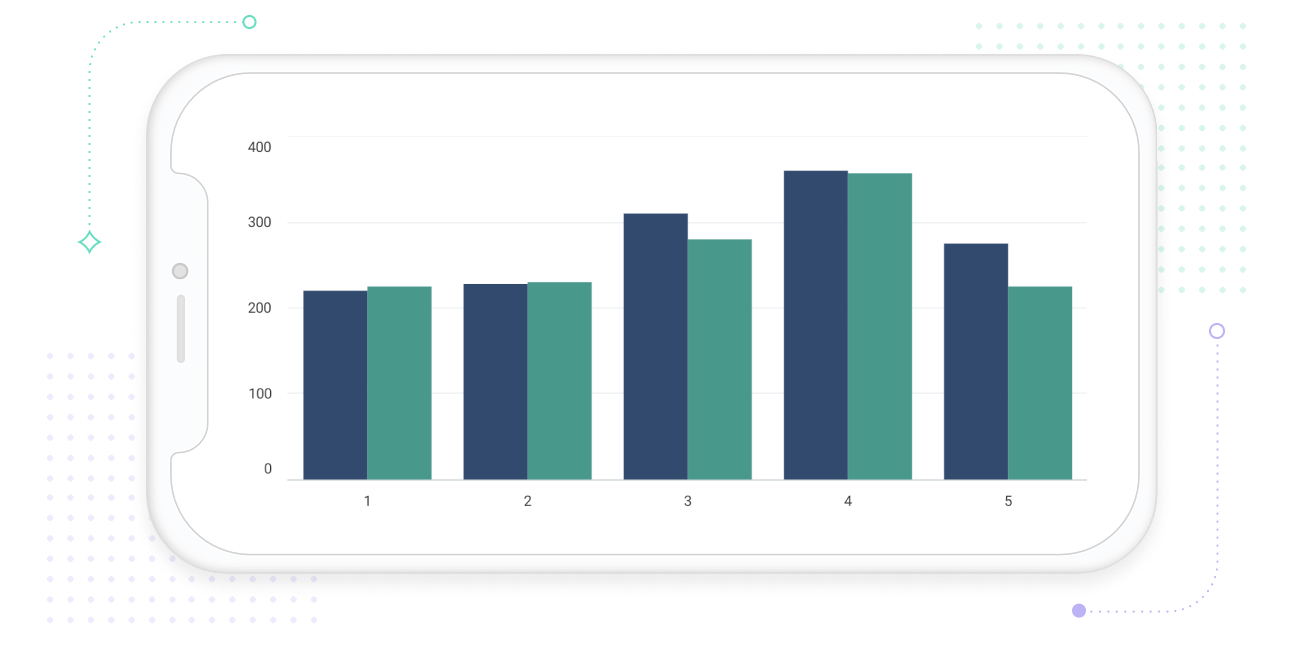
Numeric axis
Use a numeric scale and display numbers in equal intervals in axis labels.
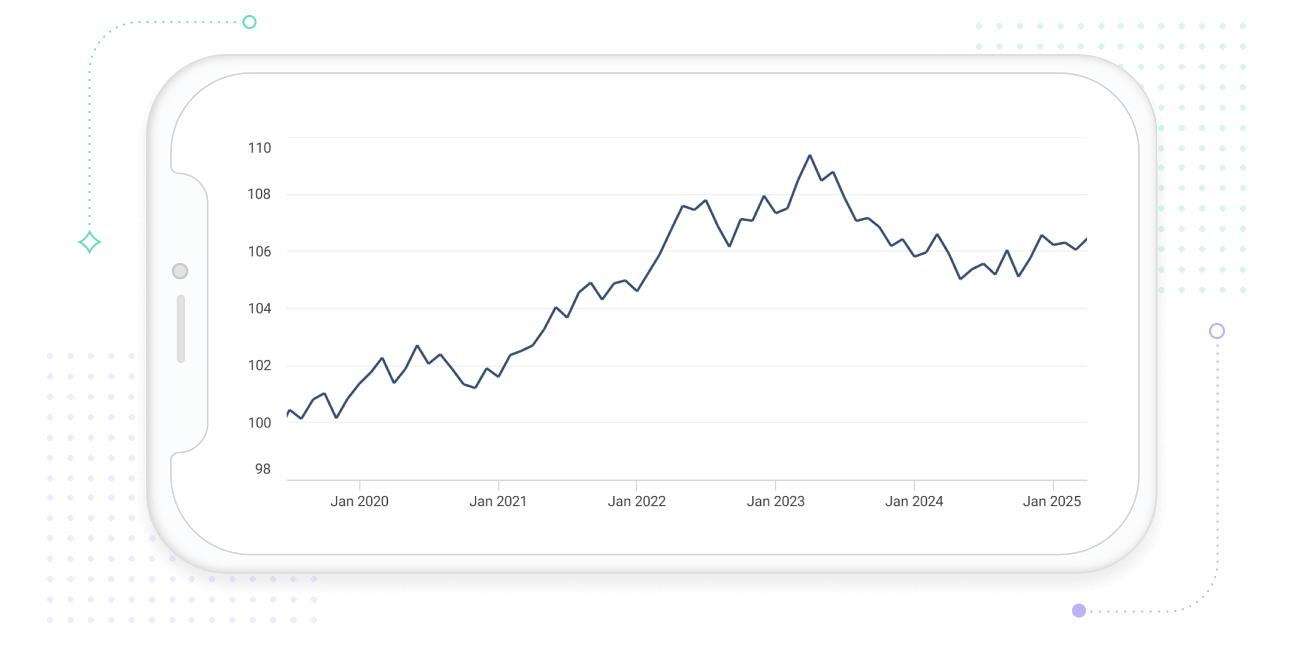
Date-time axis
Display date-time values in equal intervals in axis labels. A date-time axis is typically used as the x-axis.
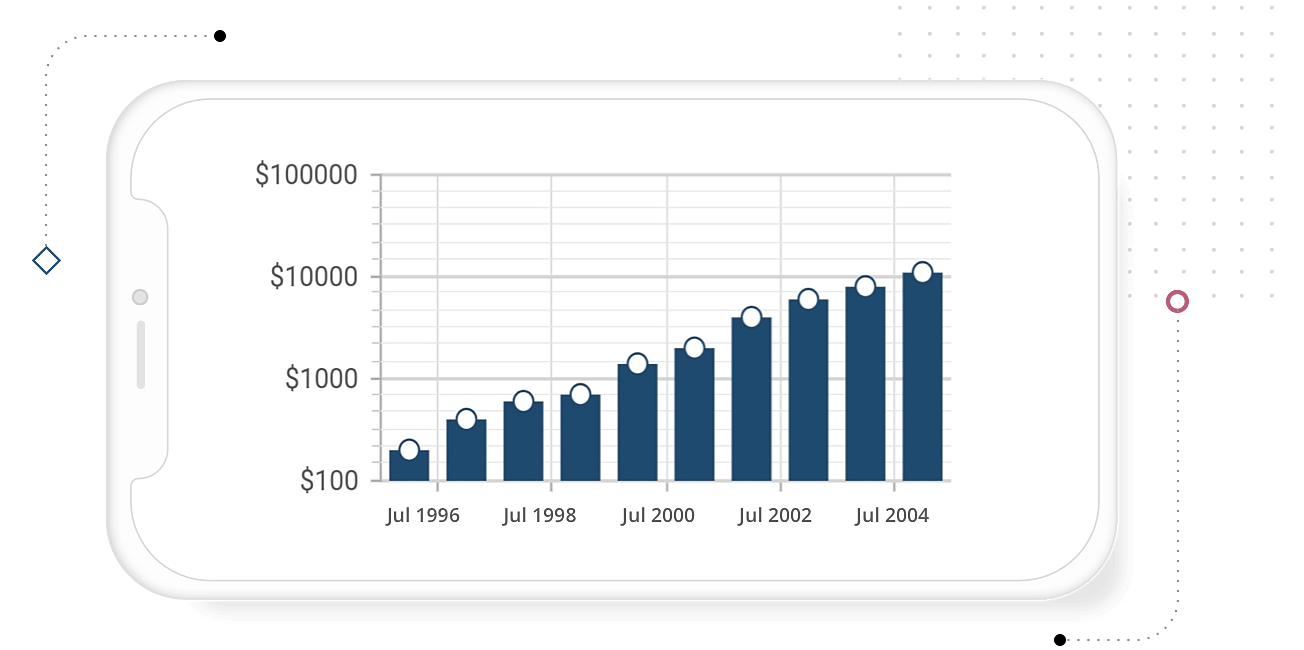
Logarithmic axis
Use a logarithmic scale and display numbers as axis labels.
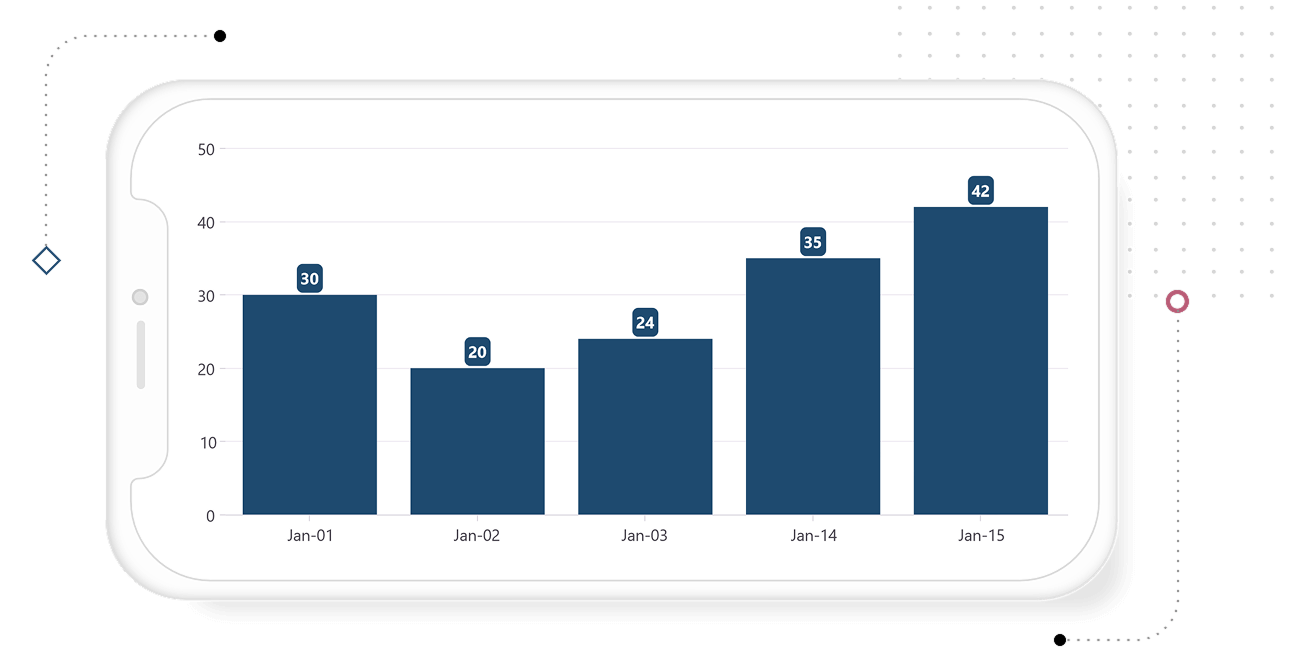
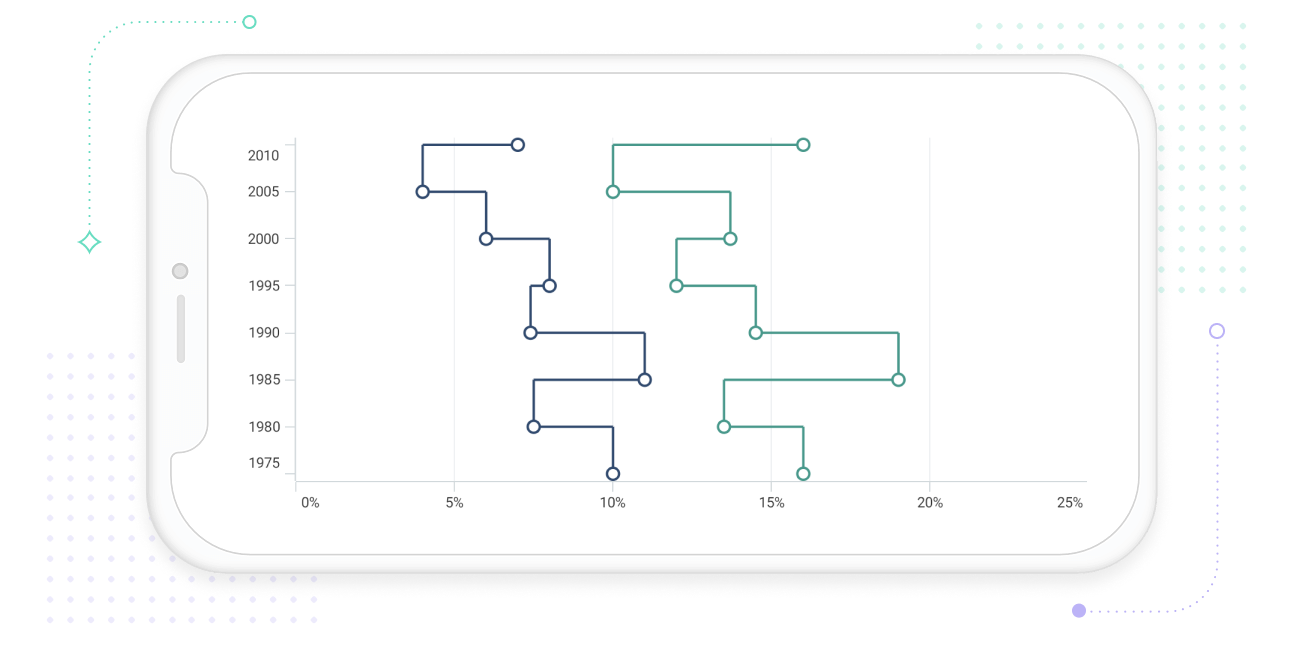
Date-time category axis
Display data points with equal spacing, eliminating gaps for missing values. This axis is typically used as the x-axis.
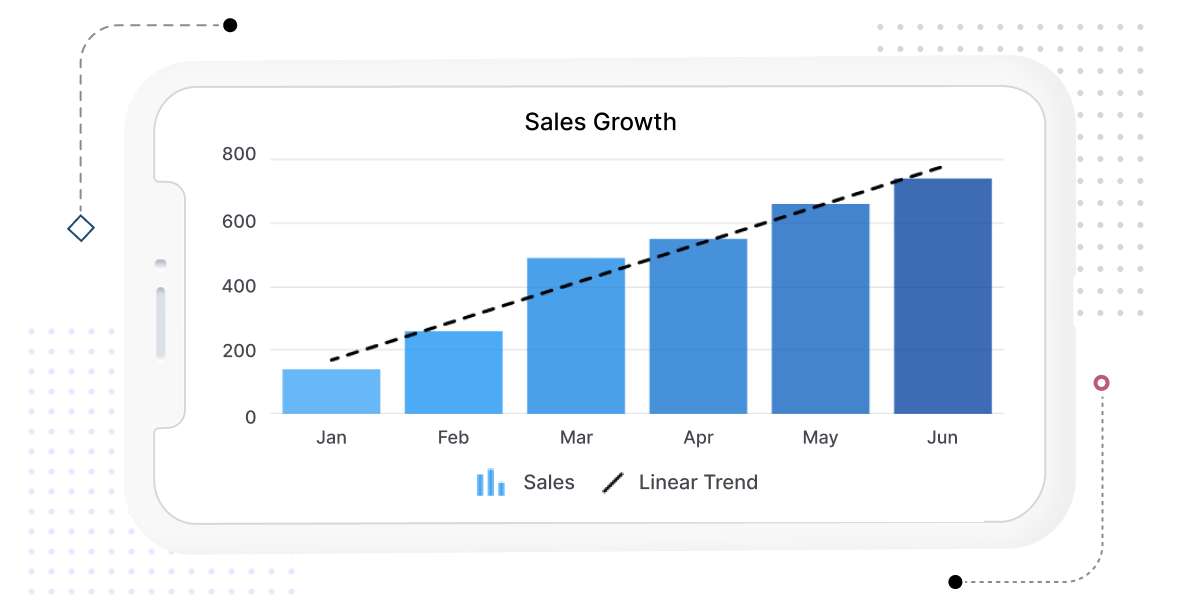
Trendlines
The .NET MAUI Cartesian Charts component provides six trendlines—linear, exponential, polynomial, logarithmic, power, and moving average—to show overall data direction.

Exponential trendline
Use a curved line for values that rise or fall faster over time.

Polynomial trendline
Show multiple turns in the data with higher-order curves.


Power trendline
Model values that grow by a constant factor with a curved power line.

Moving average trendline
Smooth noisy data by averaging points across a sliding window.
User interactions
The end-user experience is greatly enhanced by interactive features such as zooming, panning, selection, and tooltips.
Zooming and panning
Improve the readability of data points by zooming and panning. Zooming is performed by pinching or double-tapping the content.
More details on .NET MAUI Cartesian Charts user interactions
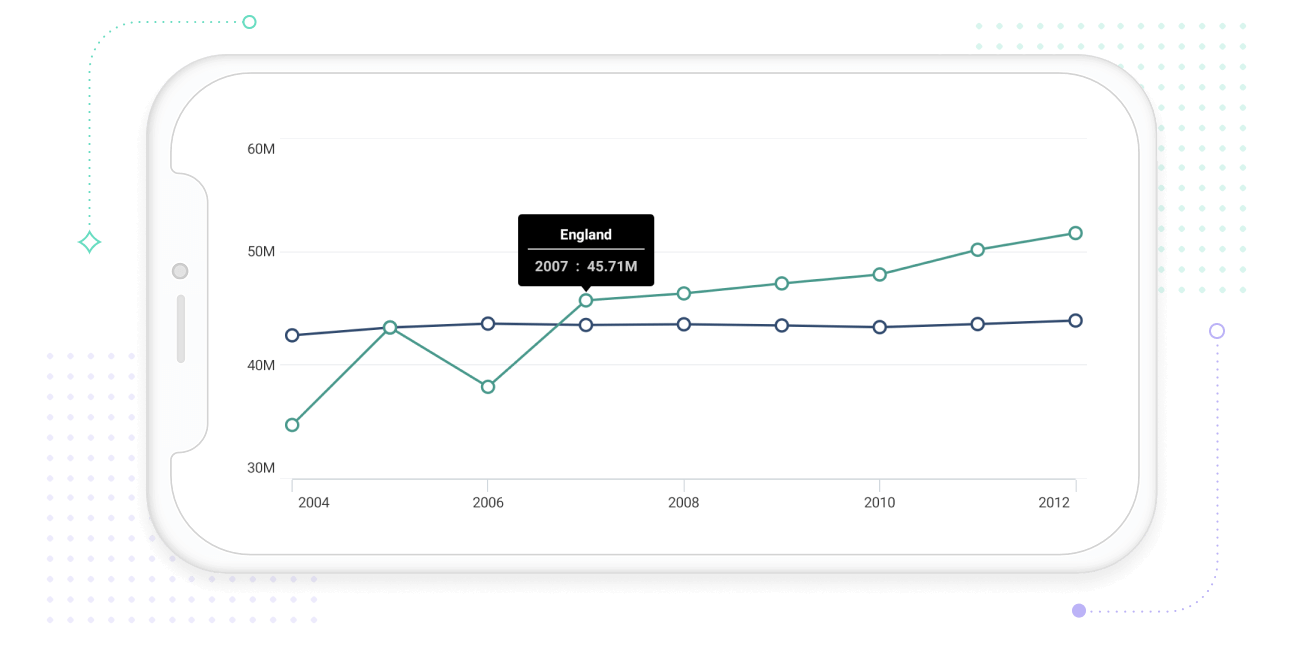
Tooltips
A tooltip displays a pop-up with additional information when a user taps on a data point.
More details on .NET MAUI Cartesian Charts user interactions
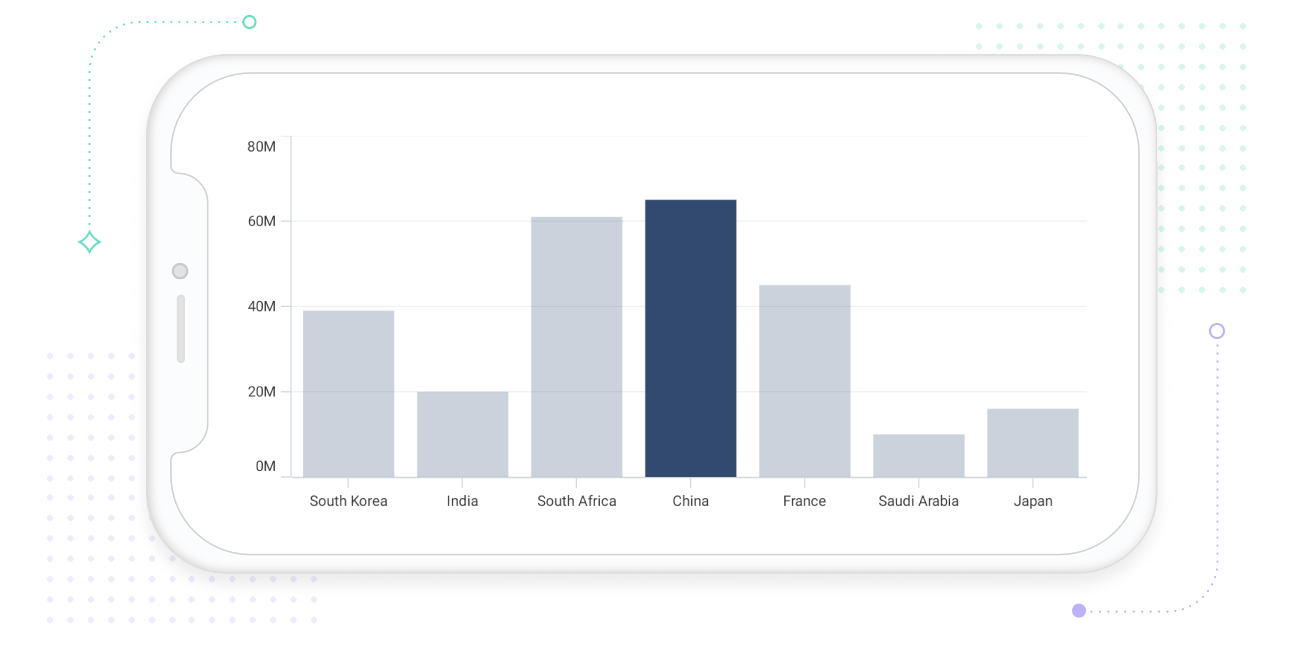
Selection
Interactively select and highlight a data point. This is usually used to navigate to another page that contains information about the selected data point or to update other components in the same page based on the selected data point in the chart.
More details on .NET MAUI Cartesian Charts user interactions
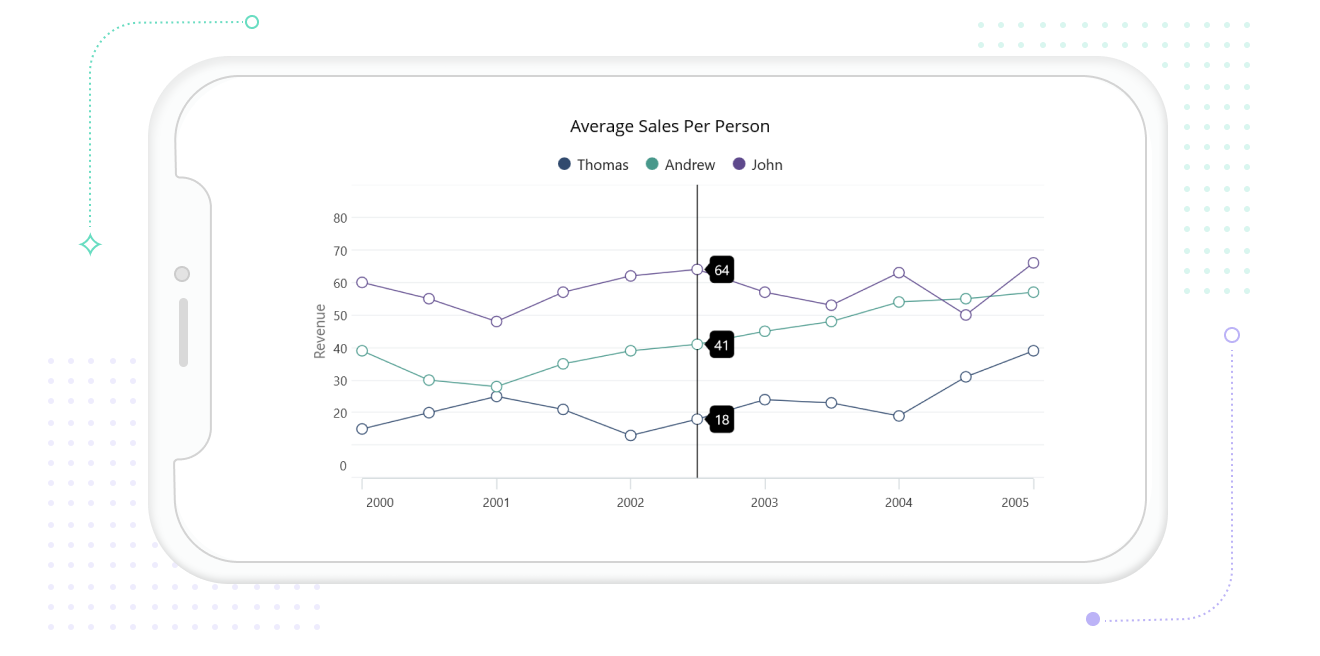
Trackballs
View information about the data point closest to the touch contact point using the trackball in .NET MAUI Cartesian Charts.
More details on .NET MAUI Cartesian Charts user interactions
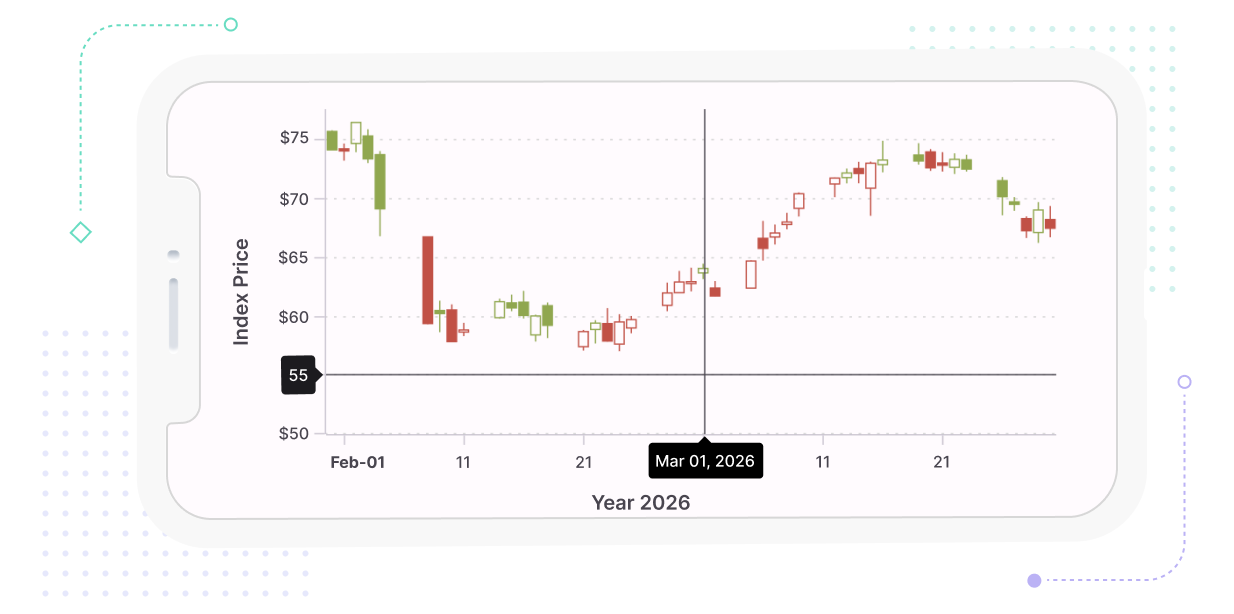
Crosshair
Display precise values at the interaction point with crosshair lines and labels to enhance readability.
More details on .NET MAUI Cartesian Charts user interactions
Auto scrolling
Auto scrolling makes a specified range of data points always visible in a chart, and the remaining data points can be viewed by scrolling.
Other exciting features
From a vast collection of features available in .NET MAUI Cartesian Charts, a few are described here.
Vertical charts
Rotate all the series in the .NET MAUI Cartesian Charts control to plot data vertically and view it from a different perspective.
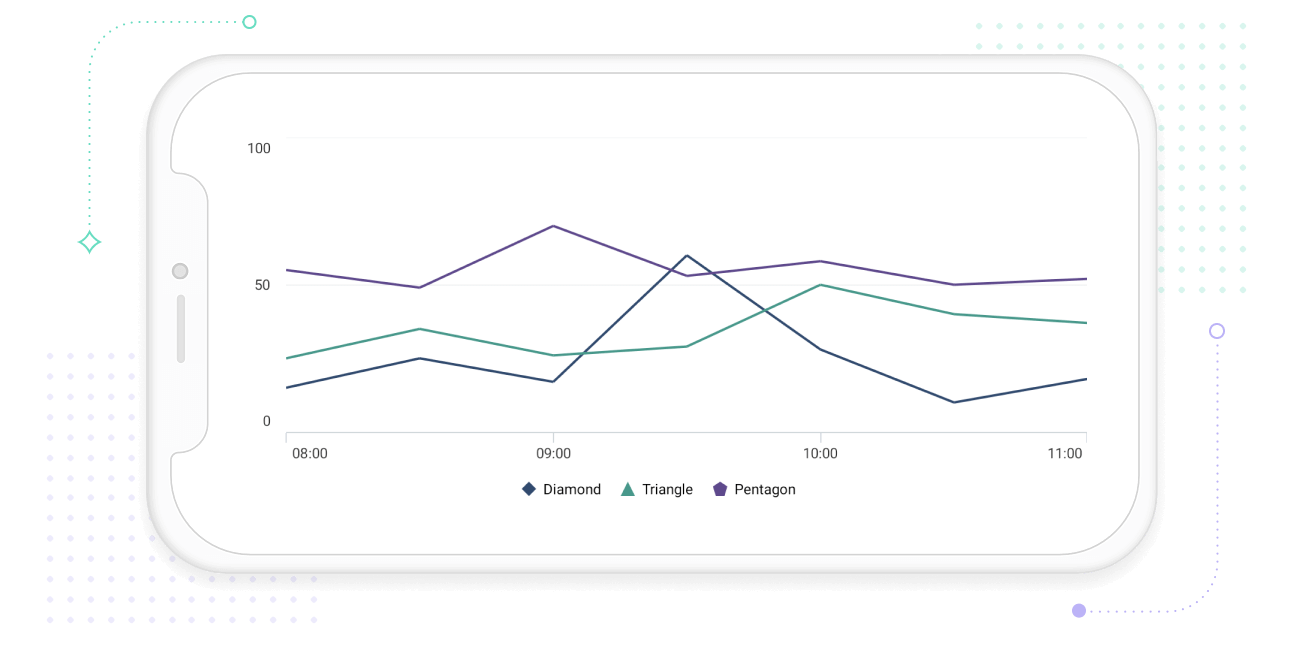
Legends
Legends provide additional information helpful in identifying individual data points in the .NET MAUI Cartesian Charts control.
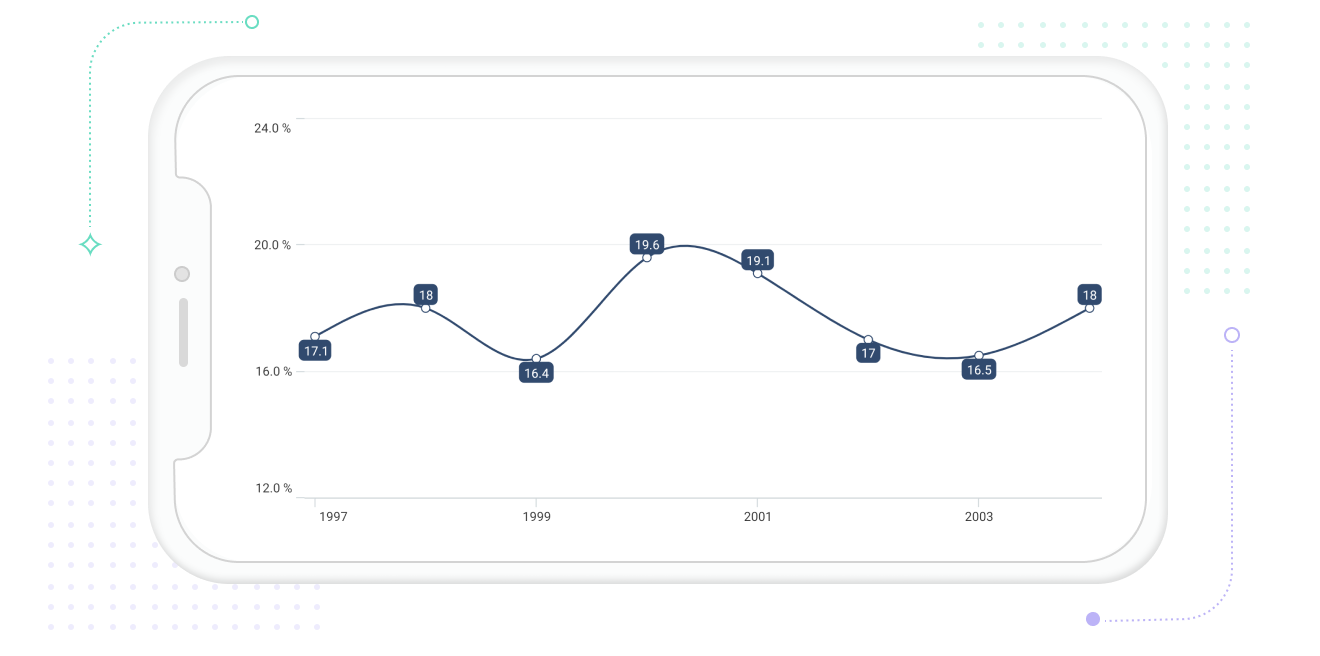
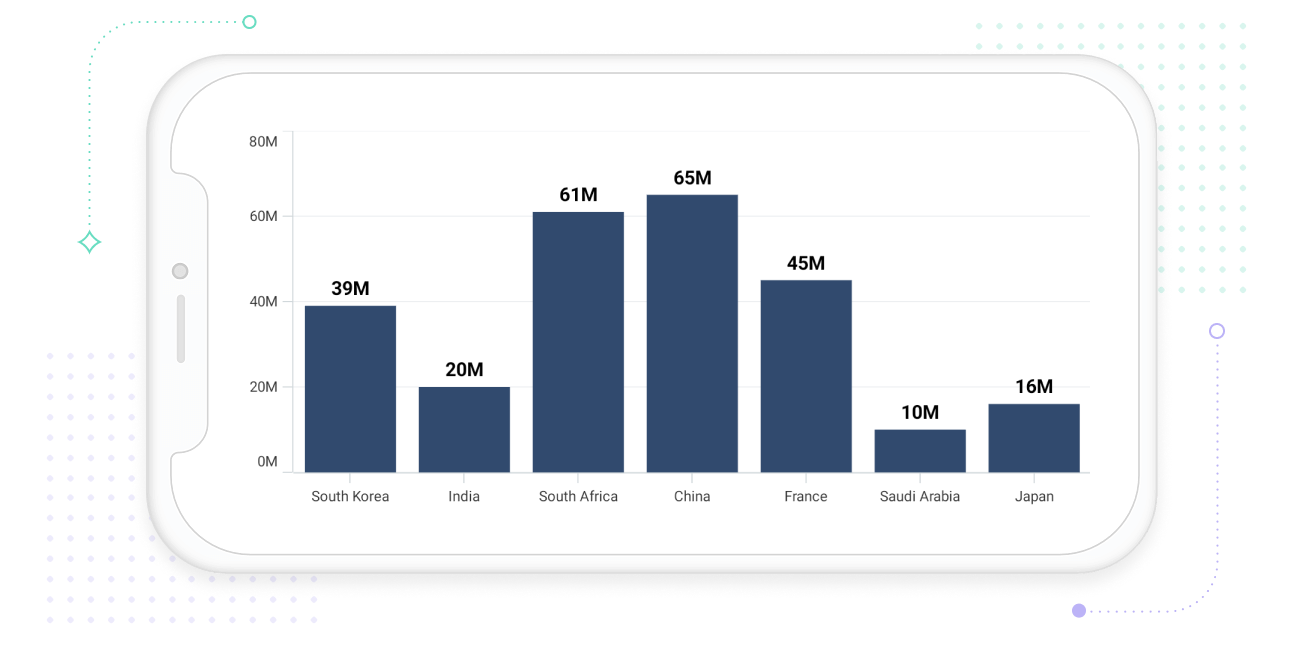
Data labels and markers
Data points can easily be annotated with labels to improve the readability of a Cartesian chart. Readability can further be enhanced by adding markers or customizable symbols.
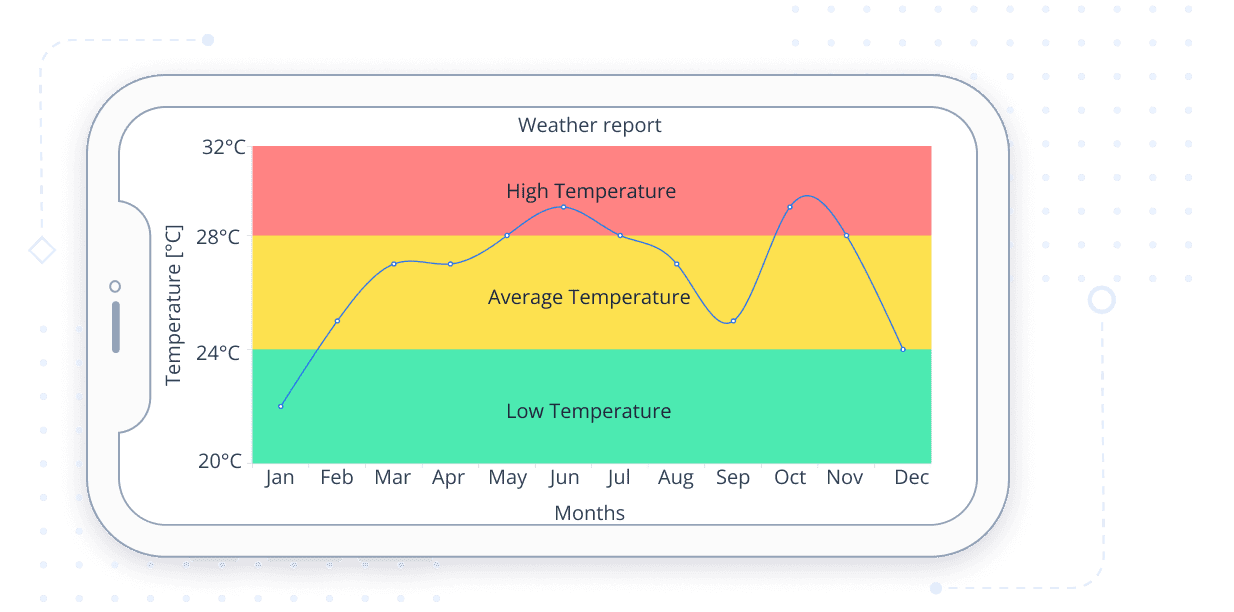
Plot band
A plot band highlights specific regions in the chart area. Users can add text to describe the highlighted area.
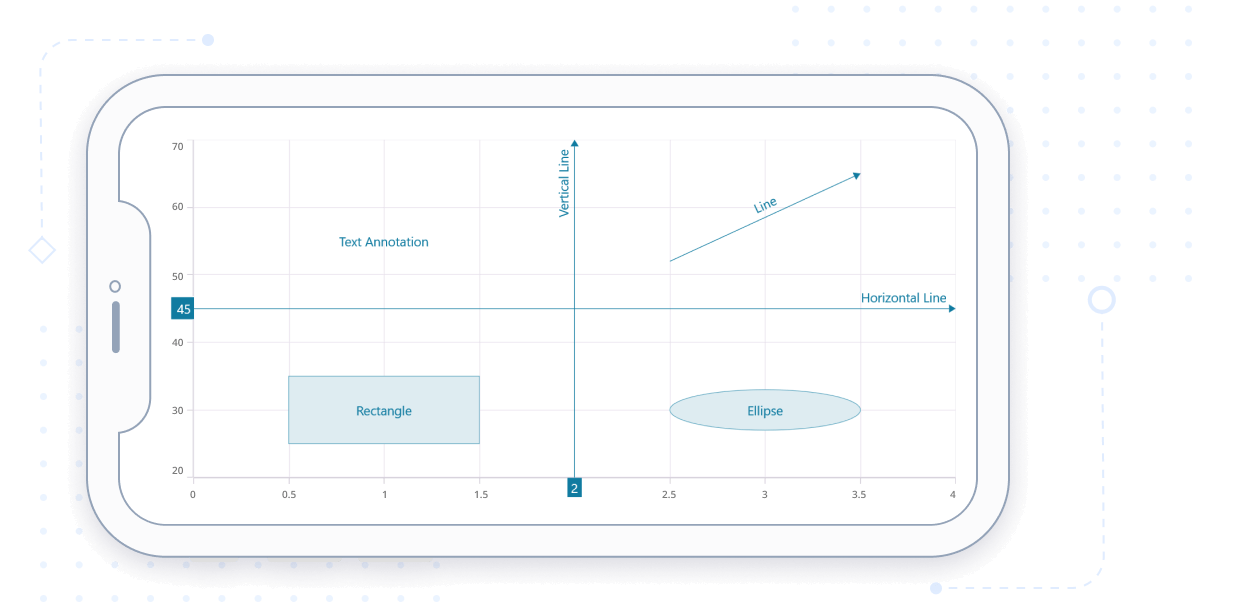
Annotations
Annotations display metadata for charts or series at specific points, positioned precisely with coordinates, alignable using pixels or axes, and available in various types such as text, shapes, or views.
Smooth animation
Dynamically updated data points are rendered with smooth animation.
Not sure how to create your first .NET MAUI Cartesian Charts? Our tutorial videos and documentation can help.
I’d love to watch it now I’d love to read it nowFrequently Asked Questions
Why should you choose Syncfusion .NET MAUI Cartesian Charts?
The Syncfusion .NET MAUI Cartesian Charts control supports the following features:
Supports zooming, panning, tooltips, trackball, and selection, making charts highly interactive and enhancing user engagement.
Provides extensive styling options for axes, labels, legends, and series to match your app’s design.
- Offers intuitive, well-documented APIs for quick integration and customization.
- Includes line, column, area, scatter, bubble, financial, stacked, and range charts for versatile data visualization.
- One of the best .NET MAUI Cartesian Charts in the market, offering feature-rich UI to interact with the software.
Simple configuration and APIs.
- Mobile-touch friendly.
Extensive demos and documentation to learn quickly and get started with .NET MAUI Cartesian charts.
Where can I find the Syncfusion .NET MAUI Cartesian Charts demo?
You can find our .NET MAUI Cartesian Charts demo, which demonstrates how to render and configure the Cartesian Charts.
Can I download and utilize the Syncfusion .NET MAUI Cartesian Charts for free?
No, this is a commercial product and requires a paid license. However, a free community license is also available for companies and individuals whose organizations have less than $1 million USD in annual gross revenue, 5 or fewer developers, and 10 or fewer total employees.
How do I get started with Syncfusion .NET MAUI Cartesian s?
A good place to start would be our comprehensive getting started documentation.
Our Customers Love Us


See Real Success Stories
Developers around the world trust Syncfusion’s Essential Studio to simplify complex projects and speed up delivery. With a vast library of UI controls, powerful SDKs, and reliable support, Essential Studio helps teams build enterprise-ready applications with confidence.
Read Our Customer StoriesIndustry
Software development
75% Cost reduction
50% Faster development
Industry
Utilities (oil and gas)
450+ hours saved
Streamlined processes and hours of development effort saved.
Advanced, flexible features
Empowered users through robust and versatile functionality.
Industry
Software and technology
1000+ of hours saved
Accelerated development with enterprise-ready UI components.
Efficient file management
Streamlined workflows with document libraries without building them from scratch.
Industry
Software and technology
2 Years of delay avoided
Two years of delays prevented with proactive planning.
On-time delivery
Projects delivered on schedule using trusted controls.
Industry
IT services and IT consulting
Improved performance
Large datasets handled with easy customization and quick debugging.
Highly customizable
Plug-and-play controls with quick template integration.
Industry
Professional services
Instant access
Quick availability of features and resources.
Reduced dependencies
Fewer dependencies for faster development.
Rated by users across the globe
.NET MAUI DataViz & UI Controls


 .NET MAUI UI Kit
Awards
Greatness—it’s one thing to say you have it, but it means more when others recognize it. Syncfusion® is proud to hold the following industry awards.

