Overview
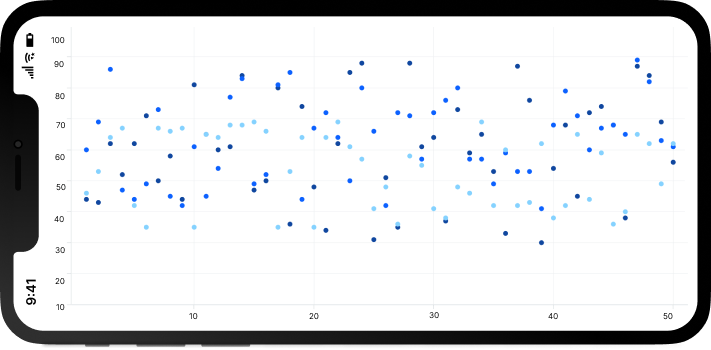
The .NET MAUI scatter chart plots data with two numeric parameters. Plot multiple scatter series in a single chart to compare different data sets. The scatter chart uses Cartesian coordinates to display values for two variables, typically, for a set of data.
.NET MAUI Scatter Chart documentation
Key features
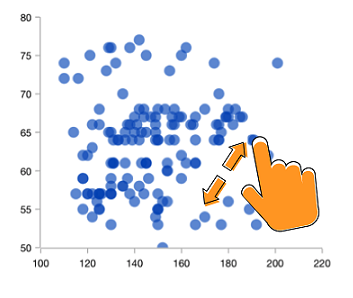
Zooming and panning
Zoom and pan to visualize data points in any region when dealing with large amounts of data.
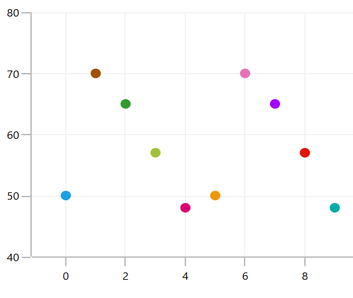
UI styling
The look and feel of a scatter chart can be customized using built-in APIs.
Code example
<ContentPage xmlns="http://schemas.microsoft.com/dotnet/2021/maui"
        xmlns:x="http://schemas.microsoft.com/winfx/2009/xaml"
        x:Class="ChartExample.MainPage"
        xmlns:local="using:ChartExample"
        xmlns:chart="clr-namespace:Syncfusion.Maui.Charts;assembly=Syncfusion.Maui.Charts">

    <Grid>
        <chart:SfCartesianChart HorizontalOptions="FillAndExpand" VerticalOptions="FillAndExpand">
            <!--Setting BindingContext-->
            <chart:SfCartesianChart.BindingContext>
                <local:ViewModel/>
            </chart:SfCartesianChart.BindingContext>

            <!--Initialize the horizontal axis for the .NET MAUI Cartesian Chart.-->
            <chart:SfCartesianChart.XAxes>
                <chart:CategoryAxis/>
            </chart:SfCartesianChart.XAxes>

            <!--Initialize the vertical axis for the .NET MAUI Cartesian Chart.-->
            <chart:SfCartesianChart.YAxes>
                <chart:NumericalAxis/>
            </chart:SfCartesianChart.YAxes>

            <!--Adding Scatter Series to the .NET MAUI Cartesian Chart.-->
            <chart:ScatterSeries
                        PointHeight="9"
                        PointWidth="9"
                        ItemsSource="{Binding Data}"
                        XBindingPath="Month"
                        YBindingPath="Target">
            </chart:ScatterSeries>
        </chart:SfCartesianChart>
    </Grid>
</ContentPage>
public class Model
{
public string Month { get; set; }
public double Target { get; set; }
public Model(string xValue, double yValue)
{
Month = xValue;
Target = yValue;
}
}
public class ViewModel
{
public ObservableCollection<Model> Data { get; set; }
public ViewModel()
{
Data = new ObservableCollection<Model>()
{
new Model("Jan", 50),
new Model("Feb", 70),
new Model("Mar", 65),
new Model("Apr", 57),
new Model("May", 48),
};
}
}Learning resources


.NET MAUI Scatter Chart User Guide
Learn more about the available options to customize .NET MAUI scatter charts.
