Overview
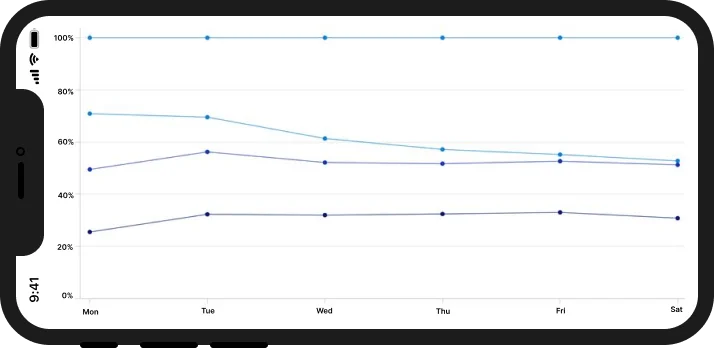
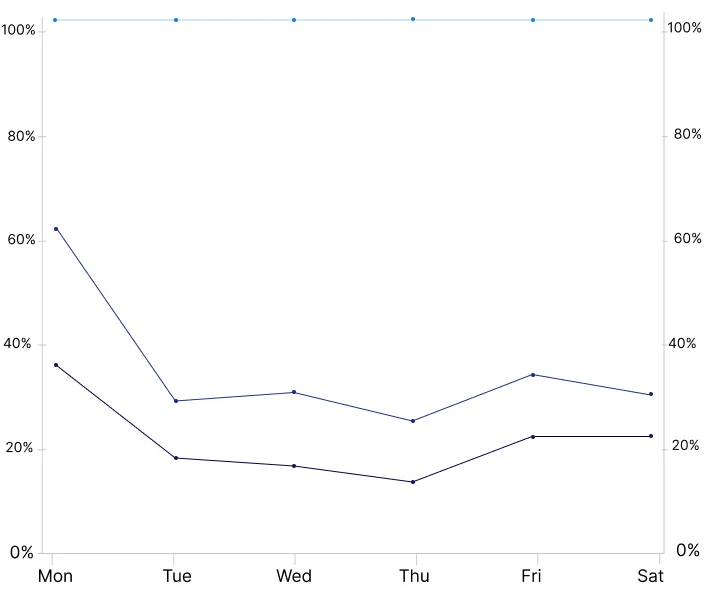
The .NET MAUI 100% stacked line chart displays multiple series of data as stacked lines, ensuring that the cumulative proportion of the stacked elements always totals 100%. The y-axis will always render within the range 0%–100%. You can create beautiful, animated, real-time, high-performance, 100% stacked line charts that also support interactive features such as zooming, panning, trackballs, and tooltips.
.NET MAUI 100% Stacked Line Chart documentation
Key features
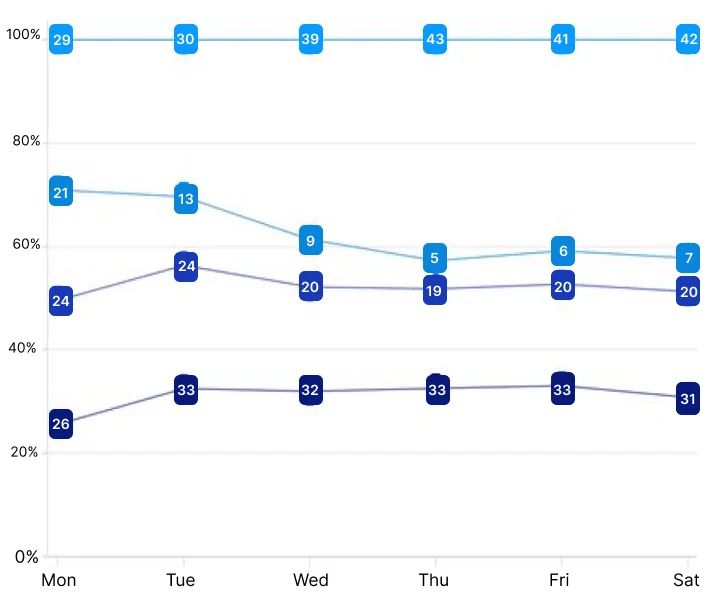
Data labels
Data labels display information about data points. Customize the label’s foreground, border, and background. Rotate a data label by a specified angle.
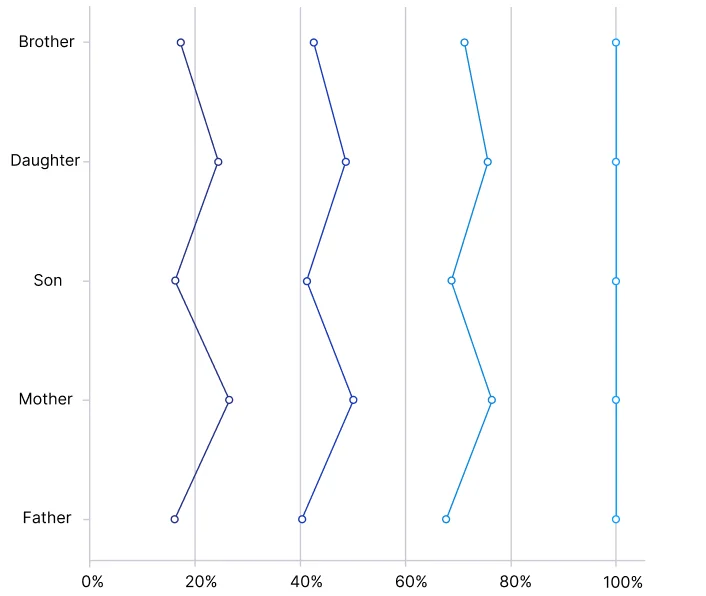
Vertical rendering
The 100% stacked line chart can be transposed vertically to view data from a different perspective.
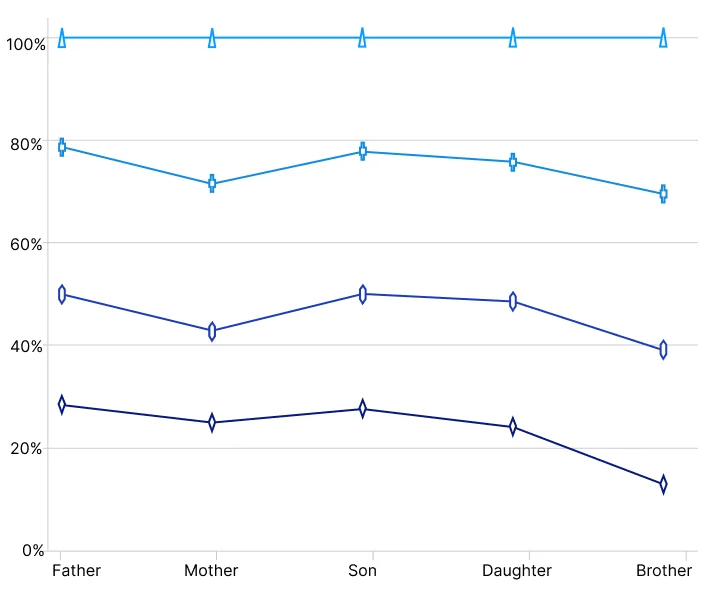
Marker
Data points in a 100% stacked line chart are visualized as marks using built-in symbols such as crosses, squares, plus signs, inverted triangles, hexagons, ellipses, vertical lines, horizontal lines, diamonds, triangles, and pentagons.
Multiple axes
Use multiple axes to plot different data sets along two or more axes, each with different data points and values.
Code example
<ContentPage xmlns="http://schemas.microsoft.com/dotnet/2021/maui"
             xmlns:x="http://schemas.microsoft.com/winfx/2009/xaml"
             x:Class="ChartExample.MainPage"
             xmlns:local="using:ChartExample"
             xmlns:chart="clr-namespace:Syncfusion.Maui.Charts;assembly=Syncfusion.Maui.Charts">

    <Grid>
        <chart:SfCartesianChart HorizontalOptions="FillAndExpand"
                                VerticalOptions="FillAndExpand">
            <!--Setting BindingContext-->
            <chart:SfCartesianChart.BindingContext>
                <local:ViewModel/>
            </chart:SfCartesianChart.BindingContext>

            <!--Initialize the horizontal axis for the .NET MAUI Cartesian Chart.-->
            <chart:SfCartesianChart.XAxes>
                <chart:CategoryAxis/>
            </chart:SfCartesianChart.XAxes>

            <!--Initialize the vertical axis for the .NET MAUI Cartesian Chart.-->
            <chart:SfCartesianChart.YAxes>
                <chart:NumericalAxis/>
            </chart:SfCartesianChart.YAxes>

            <!--Adding 100% Stacked Line Series to the .NET MAUI Cartesian Chart.-->
            <chart:SfCartesianChart.Series>
                <chart:StackingLine100Series
                            ItemsSource="{Binding Data}"
                            XBindingPath="Name"
                            YBindingPath="High"
                            ShowMarkers="True">
                </chart:StackingLine100Series>
                <chart:StackingLine100Series
                            ItemsSource="{Binding Data}"
                            XBindingPath="Name"
                            YBindingPath="Low"
                            ShowMarkers="True">
                </chart:StackingLine100Series>
                <chart:StackingLine100Series
                            ItemsSource="{Binding Data}"
                            XBindingPath="Name"
                            YBindingPath="Value"
                            ShowMarkers="True">
                </chart:StackingLine100Series>
                <chart:StackingLine100Series
                            ItemsSource="{Binding Data}"
                            XBindingPath="Name"
                            YBindingPath="Size"
                            ShowMarkers="True">
                </chart:StackingLine100Series>
            </chart:SfCartesianChart.Series>
        </chart:SfCartesianChart>
    </Grid>
</ContentPage>
public class Model
{
public string Name { get; set; }
public double High { get; set; }
public double Low { get; set; }
public double Value { get; set; }
public double Size { get; set; }
public Model(string name, double high, double low, double value,double size)
{
Name = name;
High = high
Low = low
Value = value
Size = size
}
}
public class ViewModel
{
public ObservableCollection<Model> Data { get; set; }
public ViewModel()
{
Data = new ObservableCollection<Model>()
{
new Model("Mon", 100,90,60,150),
new Model("Tue", 120,100,80,140),
new Model("Wed", 140,120,90,160),
new Model("Thu", 160,140,100,180),
new Model("Fri", 160,140,100,180),
new Model("Sat", 160,140,100,180),
};
}
}Learning resources


.NET MAUI 100 percent Stacked Line Chart User Guide
Learn available options to customize the .NET MAUI 100% Stacked Line chart.

.NET MAUI 100% Stacked Line Chart API References
Explore the .NET MAUI 100% Stacked Line chart APIs.