Overview
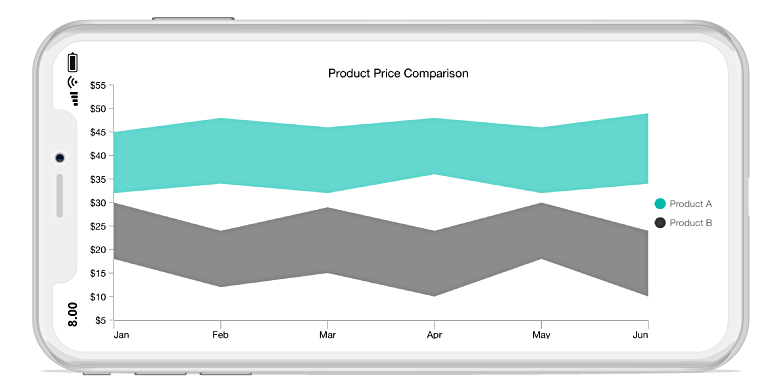
The Xamarin.Forms range area chart is used to display continuous data points as a set of lines that varies between high and low values over intervals of time and across different categories.
Key features

Vertical rendering
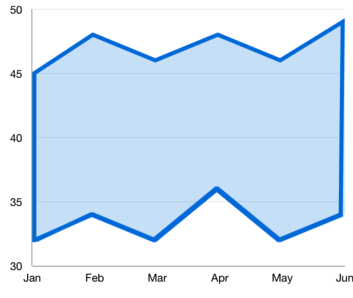
The range area chart can be transposed vertically to view data from a different perspective.

Empty point
The range area chart handles empty or null data points elegantly.
Customization
Customizes the color and thickness of the range area chart using built-in APIs to make it visually unique.
Code example
Easily get started with Xamarin Range Area Chart using a few simple lines of C# code, as demonstrated below,
<?xml version="1.0" encoding="utf-8" ?>
<ContentPage xmlns="http://xamarin.com/schemas/2014/forms"
             xmlns:x="http://schemas.microsoft.com/winfx/2009/xaml"
             xmlns:local="clr-namespace:ChartExample"
             xmlns:chart="clr-namespace:Syncfusion.SfChart.XForms;assembly=Syncfusion.SfChart.XForms"
             x:Class="ChartExample.MainPage">

    <ContentPage.BindingContext>
        <local:ViewModel/>
    </ContentPage.BindingContext>

    <chart:SfChart>

        <chart:SfChart.PrimaryAxis>
            <chart:CategoryAxis/>
        </chart:SfChart.PrimaryAxis>

        <chart:SfChart.SecondaryAxis>
            <chart:NumericalAxis/>
        </chart:SfChart.SecondaryAxis>

        <chart:RangeAreaSeries ItemsSource="{Binding Data}" XBindingPath="Month" High="High" Low="Low"/>

    </chart:SfChart>

</ContentPage>
public class Model
{
public string Month { get; set; }
public double High { get; set; }
public double Low { get; set; }
public Model(string xValue, double high, double low)
{
Month = xValue;
High = high;
Low = low;
}
}
public class ViewModel
{
public ObservableCollection<Model> Data { get; set; }
public ViewModel()
{
Data = new ObservableCollection<Model>()
{
new Model("Jan", 50, 12),
new Model("Feb", 70, 13),
new Model("Mar", 65, 14),
new Model("Apr", 57, 15),
new Model("May", 48, 10),
};
}
}Learning resources

Explore the Xamarin.Forms Range Area Chart example from GitHub to learn how to render and configure charts.

Learn available options to customize the Xamarin.Forms range area chart.

150+ XAMARIN UI CONTROLS
ALL CONTROLS
-
Xamarin.Forms
-
Xamarin.Android
-
Xamarin.iOS
-
GRIDSDATA VISUALIZATIONNAVIGATIONEDITORSLAYOUTPROJECT MANAGEMENTNOTIFICATIONDOCUMENT PROCESSING LIBRARIESVIEWER/EDITORMISCELLANEOUSCHAT
-
GRIDSDATA VISUALIZATIONNAVIGATIONEDITORSLAYOUTPROJECT MANAGEMENTNOTIFICATIONVIEWER/EDITORDOCUMENT PROCESSING LIBRARIESMISCELLANEOUS
-
GRIDSDATA VISUALIZATIONNAVIGATIONEDITORSLAYOUTPROJECT MANAGEMENTNOTIFICATIONVIEWER/EDITORDOCUMENT PROCESSING LIBRARIESMISCELLANEOUS
The most downloaded control (based on the nuget.org download count).