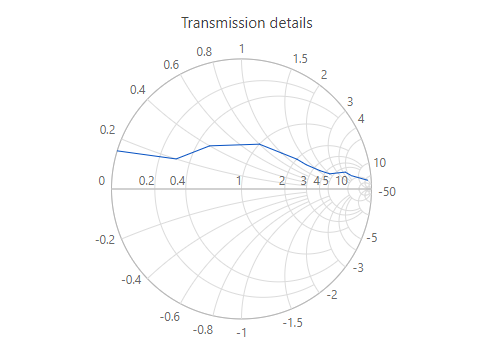
The ASP.NET Core Smith Chart is a control for showing the parameters of transmission lines in high-frequency circuit applications. Its rich feature set includes features like legends, markers, tooltips, and data labels.
Easily get started with the ASP.NET Core Smith Chart using a few simple lines of C# code example as demonstrated below. Also explore our ASP.NET Core Smith Chart Example that shows you how to render and configure the Smith Chart in ASP.NET Core.
- @using Syncfusion.EJ2;
- @using Syncfusion.EJ2.Charts;
- <div id="control-section">
- <ejs-smithchart id="smithchart" loaded="loaded">
- <e-smithchart-smithchartseriescollection>
- <e-smithchart-smithchartseries name="Transmission1"></e-smithchart-smithchartseries>
- <e-smithchart-smithchartseries name="Transmission2"></e-smithchart-smithchartseries>
- </e-smithchart-smithchartseriescollection>
- </ejs-smithchart>
- </div>
- <script>
- function loaded(args) {
- window.smithchart = args.smithchart;
- args.smithchart.series[0].points = [
- { resistance: 0, reactance: 0.05 }, { resistance: 0, reactance: 0.05 },
- { resistance: 0, reactance: 0.05 }, { resistance: 0, reactance: 0.05 },
- { resistance: 0, reactance: 0.05 }, { resistance: 0, reactance: 0.05 },
- { resistance: 0, reactance: 0.05 }, { resistance: 0, reactance: 0.05 },
- { resistance: 0, reactance: 0.05 }, { resistance: 0, reactance: 0.05 },
- { resistance: 0.3, reactance: 0.1 }, { resistance: 0.5, reactance: 0.2 },
- { resistance: 1.5, reactance: 0.5 }, { resistance: 2.0, reactance: 0.5 },
- { resistance: 2.5, reactance: 0.4 }, { resistance: 3.5, reactance: 0.0 },
- { resistance: 2.5, reactance: 0.4 }, { resistance: 3.5, reactance: 0.0 },
- { resistance: 2.5, reactance: 0.4 }, { resistance: 3.5, reactance: 0.0 },
- { resistance: 4.5, reactance: -0.5 }, { resistance: 5.0, reactance: -1.0 }
- ];
- args.smithchart.series[1].points = [{ resistance: 0, reactance: 0.15 }, { resistance: 0, reactance: 0.15 },
- { resistance: 0, reactance: 0.15 }, { resistance: 0.3, reactance: 0.2 },
- { resistance: 0.3, reactance: 0.2 }, { resistance: 0.3, reactance: 0.2 },
- { resistance: 0.3, reactance: 0.2 }, { resistance: 0.3, reactance: 0.2 },
- { resistance: 0.5, reactance: 0.4 }, { resistance: 1.0, reactance: 0.8 },
- { resistance: 2.5, reactance: 1.3 }, { resistance: 3.5, reactance: 1.6 },
- { resistance: 3.5, reactance: 1.6 }, { resistance: 3.5, reactance: 1.6 },
- { resistance: 4.5, reactance: 2.0 }, { resistance: 6.0, reactance: 4.5 },
- { resistance: 8, reactance: 6 }, { resistance: 10, reactance: 25 }];
- args.smithchart.loaded = null;
- args.smithchart.refresh();
- }
- </script>
Visualize both the impedance and admittance of transmission lines with Smith chart.
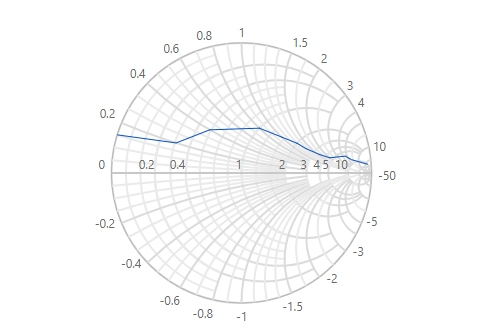
Add a title and subtitle to the ASP.NET Core Smith chart control to visualize additional information about the data represented. You can customize the font and alignment of the title and subtitle.
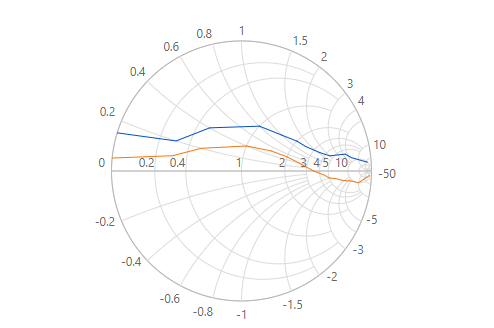
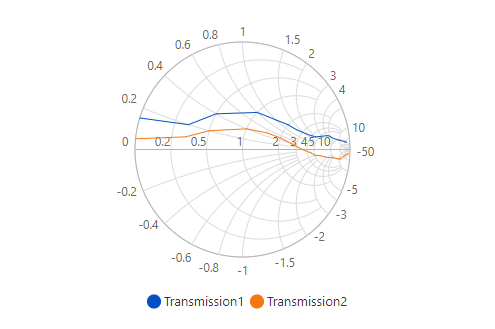
Plot any number of line series for representing data.
The ASP.NET Core Smith chart control supports a horizontal axis and radial axis. The horizontal axis is used for plotting resistance values of transmission lines and the radial axis is used for plotting nonresistance values of transmission lines.
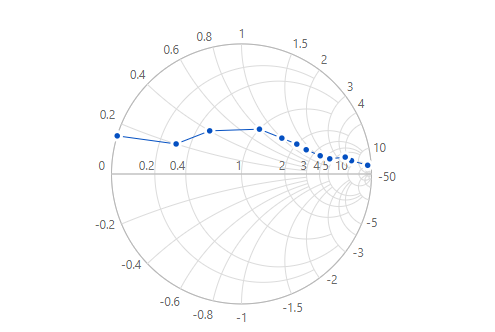
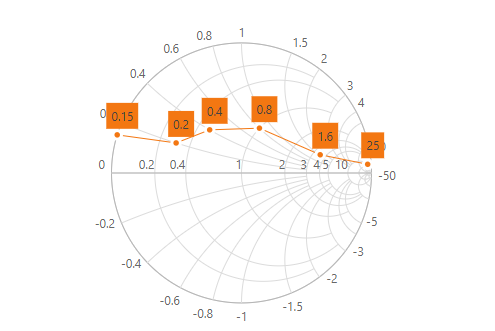
Easily annotate the data points with labels to help improve the readability of data. The data labels in the ASP.NET Core Smith chart control are smartly arranged to avoid intersection when there are large amounts of data.
A legend provides additional information that is helpful in identifying individual series in a Smith chart. It can be docked at the left, right, top, or bottom positions around the plot area. By clicking a legend item, we can toggle series visibility.
Animate the series in the ASP.NET Core Smith chart while rendering.
The interactive ASP.NET Core Smith chart displays a pop-up with additional information when the mouse is hovered over a data point.
Print or export the rendered ASP.NET Core Smith chart to save a local copy for further use.

You can export the Smith chart to a PDF document or in image formats such as SVG, PNG, and JPEG in client-side.

Print the rendered Smith chart directly from the browser.
The interactive Smith chart control also support touch interactions.

All the Smith chart features will work on touch devices with zero configuration. Use the touch features, such as tooltips and toggling series visibility using the legend, without any customization.

You can view the Smith chart control on various devices. Also hide specific elements in the Smith chart for particular screen sizes by making a very minimal change in the events.

You can render the Smith chart component in all the modern browsers.
The Smith Chart is available for the Blazor, Angular, JavaScript, Vue, and ASP.NET MVC frameworks. Explore its platform-specific options through the following links:
The ASP.NET Core Smith Chart works well with all modern web browsers, including Chrome, Firefox, Edge, Safari, and Opera.
The Syncfusion ASP.NET Core Smith Chart component includes the following features:
We do not sell the ASP.NET Core Smith Chart separately. It is only available for purchase as part of the Syncfusion team license. This contains over 1,900 components and frameworks, including the ASP.NET Core Smith Chart. The price of the team license starts at $395 per month for 5 developers, and includes support and updates until the subscription expires. In addition, we might offer discounts based on currently active promotions. Please contact our product specialists today to see if you qualify for any additional discounts.
You can find our ASP.NET Core Smith Chart demo, which demonstrates how to render and configure the Smith Chart.
No, our 1,900+ components and frameworks for web, mobile, and desktop, including our ASP.NET Core Smith Chart, are not sold individually. They are only available as part of a team license. However, we have competitively priced the product, so it only costs a little bit more than what some other vendors charge for their Smith Chart component alone. We have also found that, in our experience, our customers usually start off using one of our products and then expand to several products quickly, so we felt it was best to offer all 1,900+ components and frameworks for a subscription fee that starts at $395 per month for a team of 5 developers. Additionally, we might be able to offer discounts based on currently active promotions. Please contact our product specialists today to see if you qualify for any additional discounts.
No, this is a commercial product and requires a paid license. However, a free community license is also available for companies and individuals whose organizations have less than $1 million USD in annual gross revenue, 5 or fewer developers, and 10 or fewer total employees.
A good place to start would be our comprehensive getting started documentation.


 Figma Download
Greatness—it’s one thing to say you have it, but it means more when others recognize it. Syncfusion® is proud to hold the following industry awards.