
The React Smith Chart is a control for showing the parameters of transmission lines in high-frequency circuit applications. Its rich feature set includes features like legends, markers, tooltips, and data labels.
Visualize both the impedance and admittance of transmission lines with Smith chart.
Add a title and subtitle to the React Smith chart control to visualize additional information about the data represented. You can customize the font and alignment of the title and subtitle.
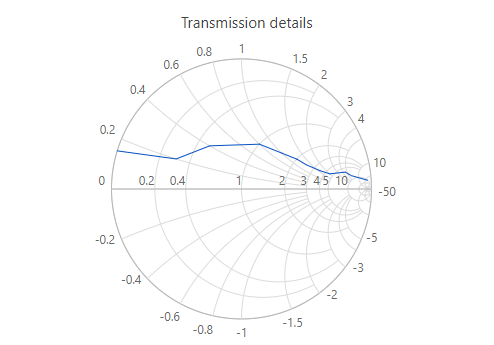
Plot any number of line series for representing data.
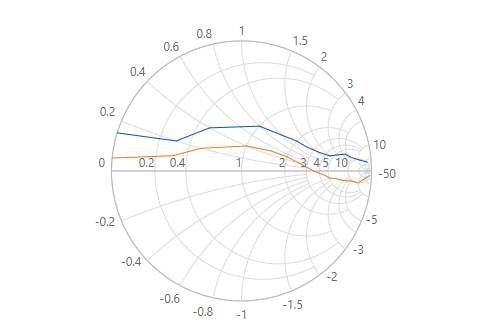
The React Smith chart control supports a horizontal axis and radial axis. The horizontal axis is used for plotting resistance values of transmission lines and the radial axis is used for plotting nonresistance values of transmission lines.
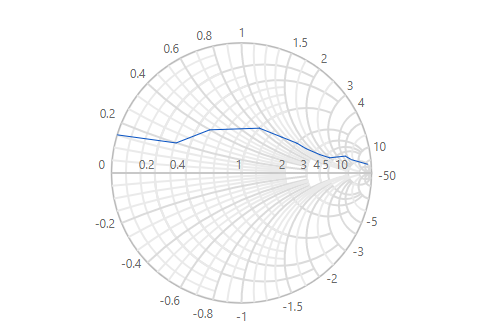
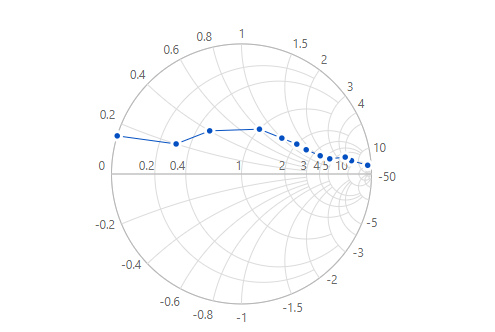
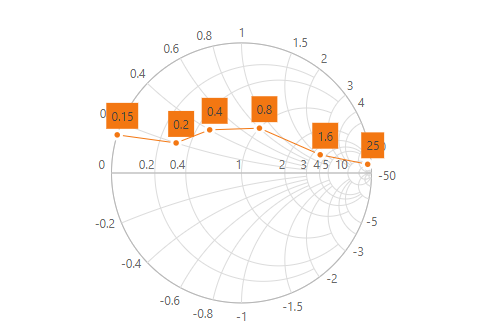
Easily annotate the data points with labels to help improve the readability of data. The data labels in the React Smith chart control are smartly arranged to avoid intersection when there are large amounts of data.
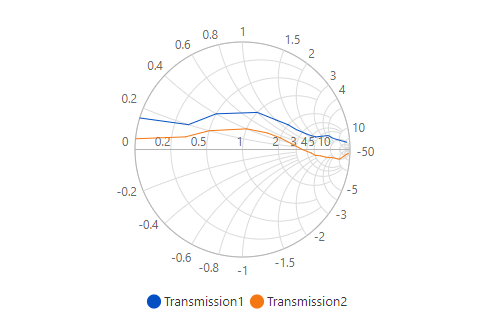
A legend provides additional information that is helpful in identifying individual series in a Smith chart. It can be docked at the left, right, top, or bottom positions around the plot area. By clicking a legend item, we can toggle series visibility.
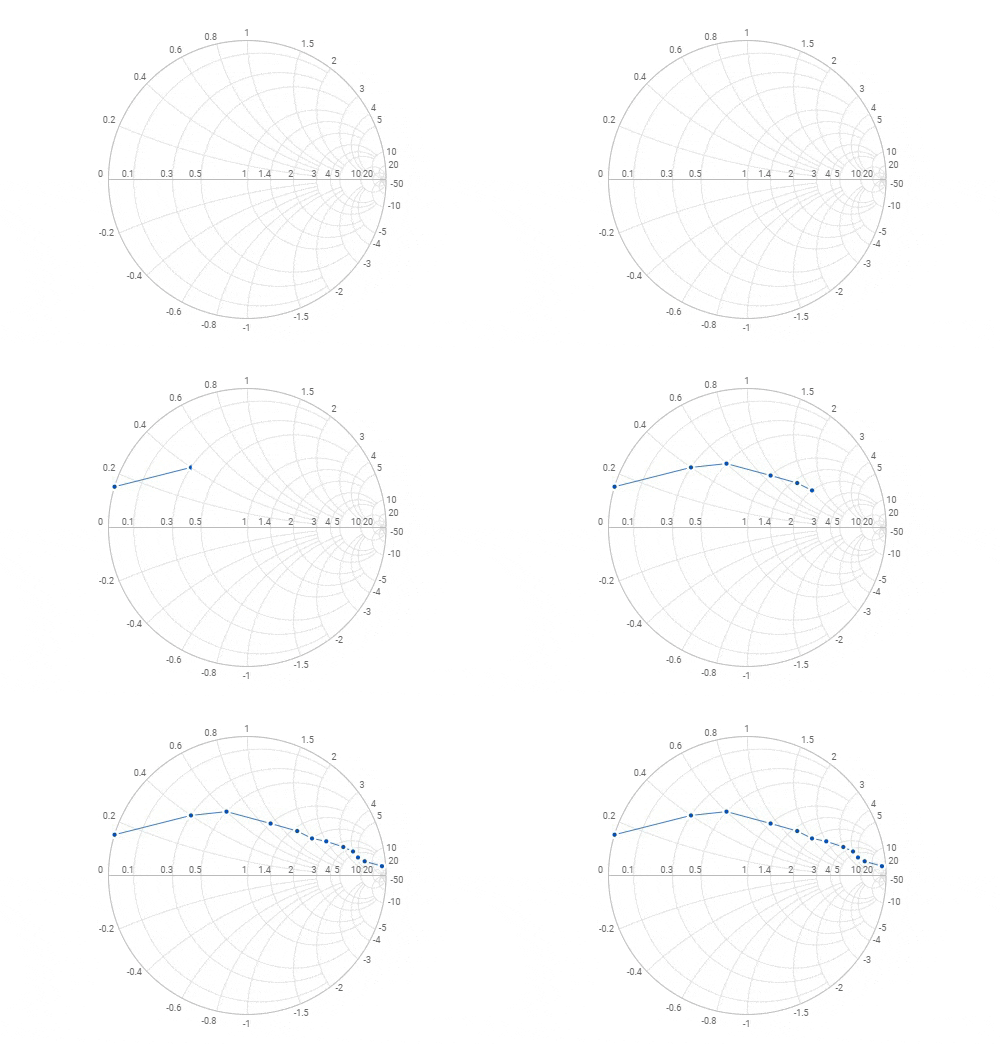
Animate the series in the React Smith chart while rendering.
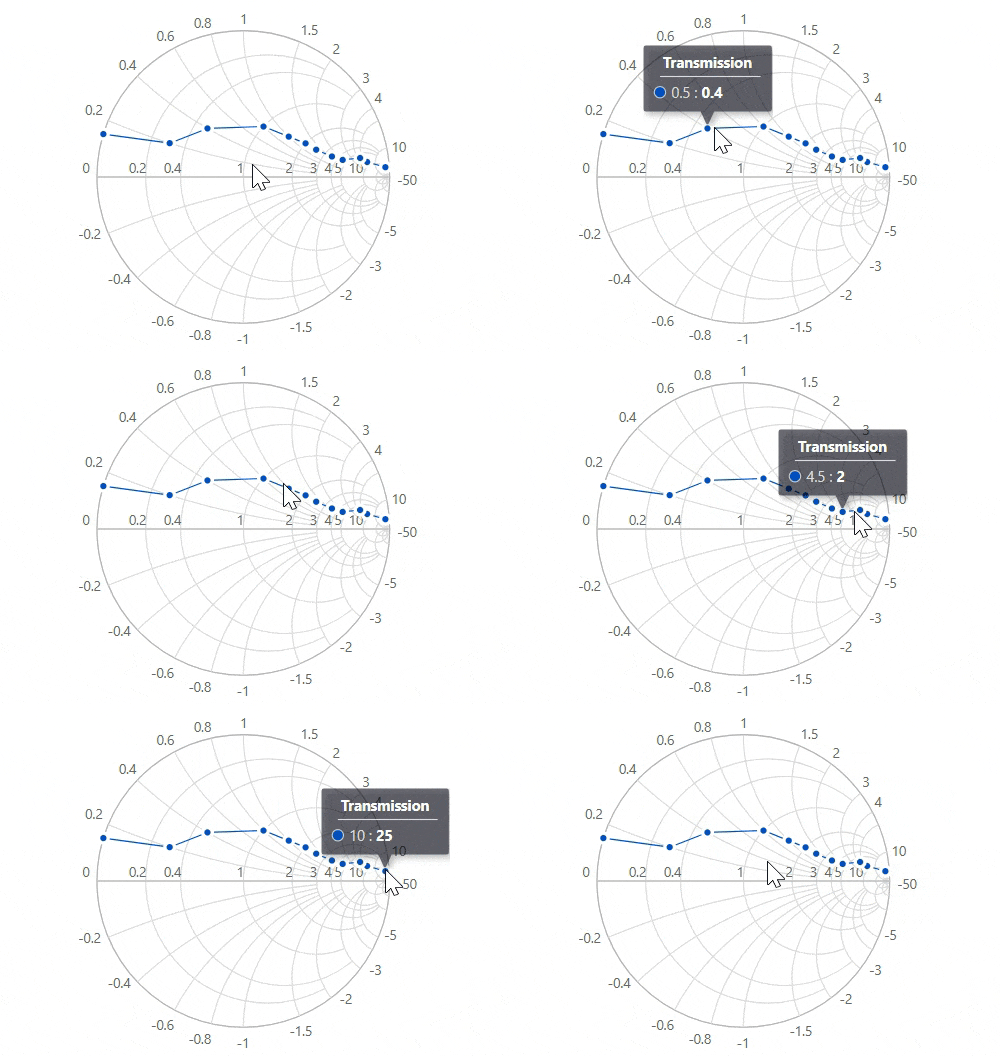
The interactive React Smith chart displays a pop-up with additional information when the mouse is hovered over a data point.
Print or export the rendered React Smith chart to save a local copy for further use.

You can export the Smith chart to a PDF document or in image formats such as SVG, PNG, and JPEG in client-side.

Print the rendered Smith chart directly from the browser.
The interactive Smith chart control also support touch interactions.

All the Smith chart features will work on touch devices with zero configuration. Use the touch features, such as tooltips and toggling series visibility using the legend, without any customization.

You can view the Smith chart control on various devices. Also hide specific elements in the Smith chart for particular screen sizes by making a very minimal change in the events.

You can render the Smith chart component in all the modern browsers.
Easily get started with the React Smith Chart using a few simple lines of TSX code example as demonstrated below. Also explore our React Smith Chart Example that shows you how to render and configure the Smith Chart in React.
- import * as React from "react";
- import * as ReactDOM from "react-dom";
- import { SmithchartComponent, SmithchartSeriesCollectionDirective, SmithchartSeriesDirective } from '@syncfusion/ej2-react-charts';
- class App extends React.Component {
- render() {
- return (<SmithchartComponent id='smithchart'>
- <SmithchartSeriesCollectionDirective>
- <SmithchartSeriesDirective points={[
- { resistance: 10, reactance: 25 }, { resistance: 8, reactance: 6 },
- { resistance: 6, reactance: 4.5 }, { resistance: 4.5, reactance: 2 },
- { resistance: 3.5, reactance: 1.6 }, { resistance: 2.5, reactance: 1.3 },
- { resistance: 2, reactance: 1.2 }, { resistance: 1.5, reactance: 1 },
- { resistance: 1, reactance: 0.8 }, { resistance: 0.5, reactance: 0.4 },
- { resistance: 0.3, reactance: 0.2 }, { resistance: 0, reactance: 0.15 },
- ]} name='Transmission1'>
- </SmithchartSeriesDirective>
- <SmithchartSeriesDirective points={[
- { resistance: 20, reactance: -50 }, { resistance: 10, reactance: -10 },
- { resistance: 9, reactance: -4.5 }, { resistance: 8, reactance: -3.5 },
- { resistance: 7, reactance: -2.5 }, { resistance: 6, reactance: -1.5 },
- { resistance: 5, reactance: -1 }, { resistance: 4.5, reactance: -0.5 },
- { resistance: 3.5, reactance: 0 }, { resistance: 2.5, reactance: 0.4 },
- { resistance: 2, reactance: 0.5 }, { resistance: 1.5, reactance: 0.5 },
- { resistance: 1, reactance: 0.4 }, { resistance: 0.5, reactance: 0.2 },
- { resistance: 0.3, reactance: 0.1 }, { resistance: 0, reactance: 0.05 },
- ]} name='Transmission2'>
- </SmithchartSeriesDirective>
- </SmithchartSeriesCollectionDirective>
- </SmithchartComponent>);
- }
- }
- ReactDOM.render(<App />, document.getElementById('smithchart'));
The Smith Chart component is also available in Blazor, Vue, Angular, and JavaScript frameworks. Check out the different Smith Chart platforms from the links below,
 Documentation
Greatness—it’s one thing to say you have it, but it means more when others recognize it. Syncfusion® is proud to hold the following industry awards.