The WinUI Spline Area Chart is designed for visualizing quantitative data. It is an area chart type that plots a fitted curve through each data point in a series. It is used to represent time-dependent data and show trends in data at equal intervals.
WinUI Spline Area Chart Documentation

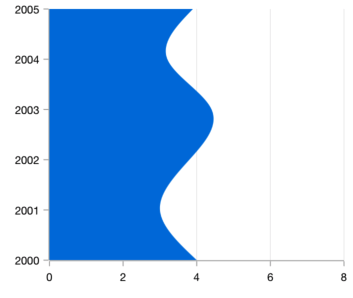
Rotate the spline area chart to plot data in a vertical direction and view data from a different perspective.
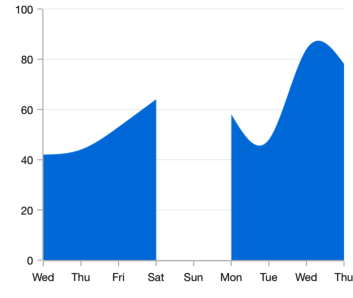
The spline area chart handles empty or null data points elegantly.

Customize the color and thickness of the spline area chart using built-in APIs to make it visually unique.
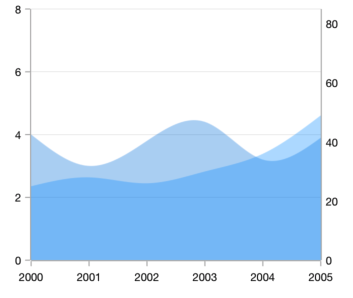
Use multiple axes to plot different data sets that widely vary from one another.
Easily get started with the WinUI Spline Area Charts using a few simple lines of XAML and C# code example as demonstrated below
- <Window x:Class="ChartExample.MainPage"
- xmlns="http://schemas.microsoft.com/winfx/2006/xaml/presentation"
- xmlns:x="http://schemas.microsoft.com/winfx/2006/xaml"
- xmlns:local="using:ChartExample"
- xmlns:d="http://schemas.microsoft.com/expression/blend/2008"
- xmlns:mc="http://schemas.openxmlformats.org/markup-compatibility/2006"
- xmlns:chart="using:Syncfusion.UI.Xaml.Charts"
- mc:Ignorable="d"
- Title="WinUI Spline Area Chart" Height="450" Width="700">
-
- <Grid>
- <chart:SfCartesianChart Height="300" Width="500">
- <!--Setting DataContext-->
- <chart:SfCartesianChart.DataContext>
- <local:ViewModel/>
- </chart:SfCartesianChart.DataContext>
-
- <!--Initialize the horizontal axis for the WinUI Chart-->
- <chart:SfCartesianChart.XAxes>
- <chart:CategoryAxis/>
- </chart:SfCartesianChart.XAxes>
-
- <!--Initialize the vertical axis for the WinUI Chart-->
- <chart:SfCartesianChart.YAxes>
- <chart:NumericalAxis/>
- </chart:SfCartesianChart.YAxes>
-
- <!--Adding Spline Area Series to the WinUI Chart-->
- <chart:SplineAreaSeries
- ItemsSource="{Binding Data}"
- XBindingPath="Month"
- YBindingPath="Target">
- </chart:SplineAreaSeries>
- </chart:SfCartesianChart>
- </Grid>
- </Window>
- public class Model
- {
- public string Month { get; set; }
-
- public double Target { get; set; }
-
- public Model(string xValue, double yValue)
- {
- Month = xValue;
- Target = yValue;
- }
- }
-
- public class ViewModel
- {
- public ObservableCollection<Model> Data { get; set; }
-
- public ViewModel()
- {
- Data = new ObservableCollection<Model>()
- {
- new Model("Jan", 50),
- new Model("Feb", 70),
- new Model("Mar", 65),
- new Model("Apr", 57),
- new Model("May", 48),
- };
- }
- }

WinUI Spline Area Chart User Guide
Learn more about the available options to customize WinUI Spline Area Charts.

