BoldSign®Effortlessly integrate e-signatures into your app with the BoldSign® API. Create a sandbox account!
The Flutter 100% Stacked Column Chart displays multiple series of data as stacked columns, ensuring that the cumulative proportion of each stacked element always totals 100%. Thus, the y-axis will always render within the range 0–100. This chart type is best suited for depicting the relative contribution of data points. You can create beautiful, animated, real-time and high-performance 100% stacked column chart that also supports the interactive features such as zooming and panning, trackball, crosshair, tooltip and selection.


Group a series with another series using the group name in the Flutter 100% Stacked Column Chart. Group the series with different stacking name separately.
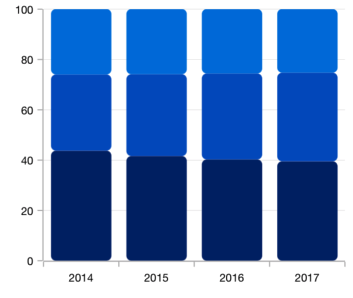
Modernize the UI by applying the rounded corners to the Flutter 100% Stacked Column Chart.

The 100% Stacking Column Chart provides an option to customize the spacing between two rectangle.

Flutter Stacked Column Chart User Guide
Learn available options to customize the Flutter stacked column chart.
39K+
12K+
15K+
27K+
39K+
12K+
15K+
27K+

