Overview
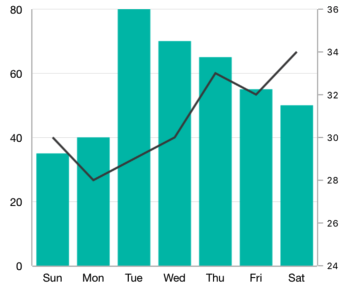
The Flutter Combination Chart visualizes data by combining two or more charts into a single chart. You can visualize two different kinds of data correlated in a meaningful way, i.e., revenue vs profit. You can create beautiful, animated, real-time and high-performance combination chart that also supports the interactive features such as zooming and panning, trackball, crosshair, tooltip and selection.

Key features

Multiple axes
Plot different units of data using multiple axes in a single chart. It can be positioned at either side of the chart.
Color palette
Efficiently handle the colors of the Flutter Combination Chart using the color palette.

Interactive features
Experience smooth interaction in Flutter Combination Chart using the built-in interactive features.
Code example
Easily get started with the Flutter Combination Chart using a few simple lines of DART code example as demonstrated below,
import 'package:flutter/material.dart';
import 'package:syncfusion_flutter_charts/charts.dart';

void main() {
  return runApp(_ChartApp());
}

class _ChartApp extends StatelessWidget {
  @override
  Widget build(BuildContext context) {
    return MaterialApp(
      theme: ThemeData(primarySwatch: Colors.blue),
      home: _MyHomePage(),
    );
  }
}

class _MyHomePage extends StatefulWidget {
  // ignore: prefer_const_constructors_in_immutables
  _MyHomePage({Key? key}) : super(key: key);

  @override
  _MyHomePageState createState() => _MyHomePageState();
}

class _MyHomePageState extends State<_MyHomePage> {
  late List<_ChartData> data;
  late TooltipBehavior _tooltip;

  @override
  void initState() {
    data = [
      _ChartData('CHN', 12, 15),
      _ChartData('GER', 15, 10),
      _ChartData('RUS', 30, 24),
      _ChartData('BRZ', 6.4, 11),
      _ChartData('IND', 14, 9)
    ];
    _tooltip = TooltipBehavior(enable: true);
    super.initState();
  }

  @override
  Widget build(BuildContext context) {
    return Scaffold(
        appBar: AppBar(
          title: const Text('Syncfusion Flutter chart'),
        ),
        body: SfCartesianChart(
            primaryXAxis: CategoryAxis(),
            primaryYAxis: NumericAxis(minimum: 0, maximum: 40, interval: 10),
            tooltipBehavior: _tooltip,
            series: <CartesianSeries<_ChartData, String>>[
              ColumnSeries<_ChartData, String>(
                  dataSource: data,
                  xValueMapper: (_ChartData data, _) => data.x,
                  yValueMapper: (_ChartData data, _) => data.y,
                  name: 'Gold',
                  color: Color.fromRGBO(8, 142, 255, 1)),
              LineSeries<_ChartData, String>(
                  dataSource: data,
                  xValueMapper: (_ChartData data, _) => data.x,
                  yValueMapper: (_ChartData data, _) => data.y1,
                  name: 'Gold',
                  color: Color.fromRGBO(8, 142, 255, 1))
            ]));
  }
}

class _ChartData {
  _ChartData(this.x, this.y, this.y1);

  final String x;
  final double y;
  final double y1;
}
Learning resources

GitHub Code The Flutter Combination Chart configuration code is available in GitHub.

Flutter Combination Chart User Guide
Learn available options to customize the Flutter Combination Chart.