BoldSign®Effortlessly integrate e-signatures into your app with the BoldSign® API. Create a sandbox account!
The Flutter Range Area Chart is used to display continuous data points as a set of lines that varies between high and low values over intervals of time and across different categories. You can create beautiful, animated, real-time and high-performance range area chart that also supports the interactive features such as zooming and panning, trackball, crosshair, tooltip and selection.

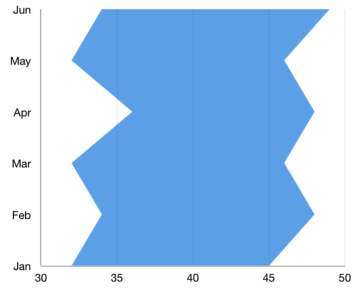
The Flutter Range Area Chart can be transposed vertically to view data from a different perspective.
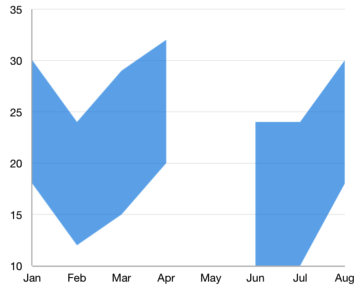
The Flutter Range Area Chart handles empty or null data points elegantly.
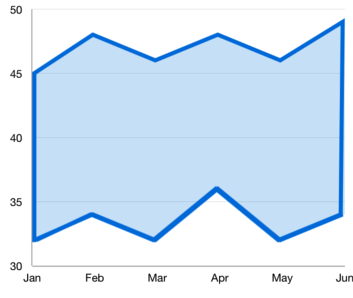
Customizes the color and thickness of the range area chart using built-in APIs to make it visually unique.

Flutter Range Area Chart User Guide
Learn available options to customize the Flutter Range Area Chart.
39K+
12K+
15K+
27K+
39K+
12K+
15K+
27K+

