
The WinForms Grouping library is a high-performance grouping engine that can group any list of data without dependencies on any particular UI component. It is highly optimized and can handle large amounts of dynamic data. It features support for related data and filters. All aspects of the grouping engine are extensible, and users can add functionalities as needed.
The grouping engine encapsulates the grouping architecture. Users set an IList data source to impose multicolumn sorts, filters, grouping with summaries, and nested tables. Grouping uses balanced binary trees as a core data structure instead of arrays. Binary trees have the advantage that parent branches can cache information about their children. Inserting, removing, and moving records only take O(log2n) operations instead of the O(n) operations with linear data structures. Users can access the engine using their own code.
Grouping has no UI dependencies. It may be used with any UI controls or no controls at all. The following examples illustrate grouping in use with standard controls.

Using grouping is straightforward. You specify a data source or IList object with public properties to the grouping engine. Once the engine is initialized, it is possible to sort, filter, group, and summarize data using straightforward code. Once the tracking items are set up (provided the data source supports IBindingList), the engine will automatically maintain the information being tracked. It can then be accessed through collections in the engine. The following image illustrates simple data that has been grouped by column C. There are three lists: the raw data, the visible data before an ExpandAll call, and finally, the visible data after the ExpandAll call. The middle section lists out the group captions, showing summary information on the group. The bottom listing shows the captions plus the actual records in the expanded groups. This is the type of raw (non-UI specific) information that grouping allows access to.


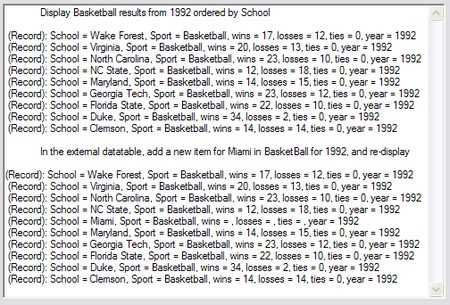
While the IBindingList data source is being edited, grouping will respond immediately to any changes. If the edit changes a record’s sort position, filter state, or group state, the engine will handle repositioning the record appropriately. Since binary trees have the advantage of parent branches caching information about their children, the position and summary information is cached in parent branches, allowing the editing changes to quickly reflect any sort or group criteria applied. If a user changes an entry such that it changes its group location or summary information, the grouping engine updates these items automatically.The following image illustrates a before and after listing of some sports statistics. In the external data table, the record for Maryland was changed to Boston College. Notice that the grouping engine placed the record in its proper sort position.

The following is a before and after listing of a group of sports statistics. In the external data table, a new record was added for the school Miami. Notice that the grouping engine placed the record in its proper sort position.
As items are deleted from an IBindingList data source, grouping will automatically remove them from any sorted, filtered, or grouped collections.
Grouping’s sorting support is flexible and not restricted to ADO.NET DataView sorting. Users can sort any IList data source. The following image displays the code to sort a collection on two keys.

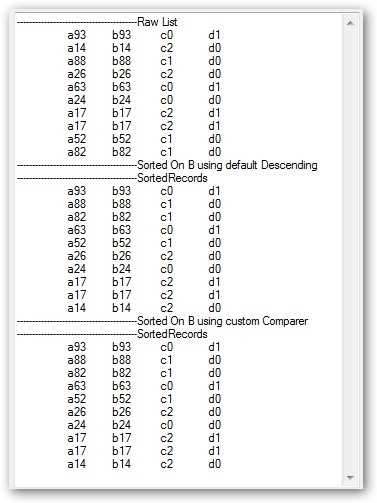
Users may provide an IComparer object to customize the sort behavior. With IComparer objects, it is possible to do things such as always position empty values at the bottom of sorted data. The following image details the use of a custom IComparer object. In the picture, column B has values such as b73, b31, etc. By default, this column would be sorted alphabetically. But with a custom sort, a user may strip off the leading “b” and have the column appear numerically sorted, ignoring the “b”. The picture displays both the default and custom sort results.
If a collection has been grouped, subsequent sorts will respect the grouping, arranging the items within the groups.
Filtering allows users to specify data of interest. Filtering is the process of constraining the display of records based on specific criteria.
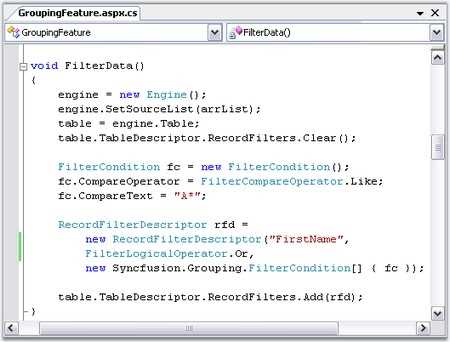
The following list includes the Filter-Compare-Operator operations currently supported by grouping: Equals checks if the field value is equal to the compare value. NotEquals checks if the field value is not equal to the compare value. LessThan checks if the field value is less than the compare value. LessThanOrEqualTo checks if the field value is less than or equal to the compare value. GreaterThan checks if the field value is greater than the compare value. GreaterThanOrEqualTo checks if the field value is greater than or equal to the compare value. Like checks if the string field value begins similarly to the compare value. Match checks if the string field value is equal to the compare value. Custom allows users to add a delegate to define the filter.
Grouping lets users add one or more summary items to each group. Each summary item automatically reflects changes made to data items.
Because of the highly optimized, balanced tree structures used in the grouping engine, the calculation of summary values is very fast with only O(log2 n) operations (where n, is the number of records in the table) .
The following image is a code sample illustrating the addition of a summary item.

The grouping engine has several built-in summaries: Int32AggregateDouble Aggregate (Count, Min, Max, Sum), String Aggregate (MaxLength, Count), CountDistinct Count (Count, Values array), Vector (Values), and Double Vector (statistical methods: Median, Min, Max, 25% Quartile, 75% Quartile). Custom summaries can easily be added. You can effectively use all of these functionalities in grid.
Use an expression to add computed values to the information in your data. For example, if your data contains a “Price” and a “Discount,” then the expression can compute the discounted price. To create an expression, users provide the following a name to associate with the new item: a “HeaderText” property that is a display name, and an algebraic expression involving other columns in the data source. The following code sample illustrates this procedure.
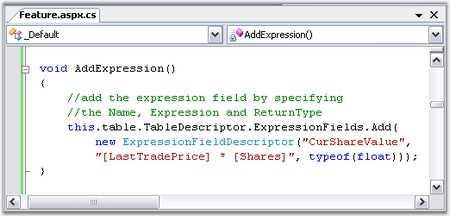
Expression fields let users add new columns with formula expressions. The grouping engine comes with its own extensible formula engine. Expression fields can be used in records just like a regular field. Users may create summaries and group, sort, or create filters based on expression fields.
The following image shows the grid grouping control with a “Gain” expression field. It is calculated based on shares and price paid. A summary of totals is displayed at the end of the group.

The following screenshot depicts grid’s grid grouping control using grouping. For flat data tables, users can employ the grid grouping control to quickly provide custom views of the data. Users can filter, group, sort, and summarize the data, and it is also easy to add custom formula columns to be used in groups and summaries. The grouping architecture is flexible, and can be used with any IList object whose items have public properties.


The grid grouping control also supports data with hierarchical relationships and nested tables. Changes to any data element automatically update the grid and the position of the changed records appropriately. New rows may be added at any level.
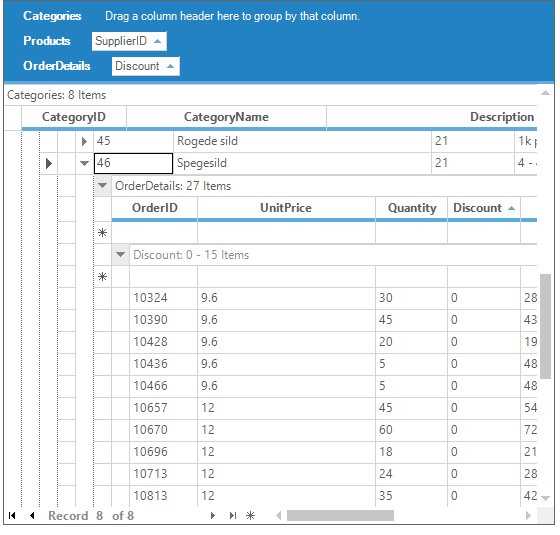
With a grid grouping control, each record in a hierarchical grid can have multiple nested relations. Users can expand the record to display nested relations. Each nested table can be expanded individually by clicking the plus-minus button next to the caption text.
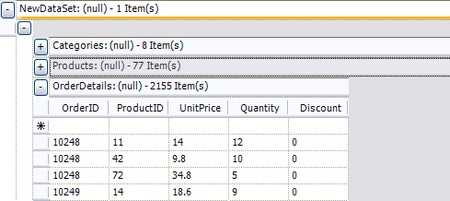
Chart can use grouping control to manipulate data, and to provide cumulative charts from instance data. The following chart displays trading volume for issues on a given day. The data in this case is a ticker-type data set that has a time stamp, a volume value, a symbol, and a price. To get the cumulative chart from this data, chart first groups the data by symbol, and then aggregates the data to get the total volume on a symbol-by-symbol basis.
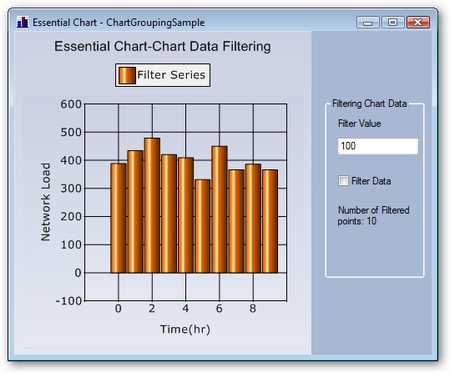
The following figure is another chart based on the same data as the previous the chart in the previous image. For this chart, grouping control has been used to filter the data, and to only display the results of the afternoon trades.

 Documentation
Greatness—it’s one thing to say you have it, but it means more when others recognize it. Syncfusion® is proud to hold the following industry awards.