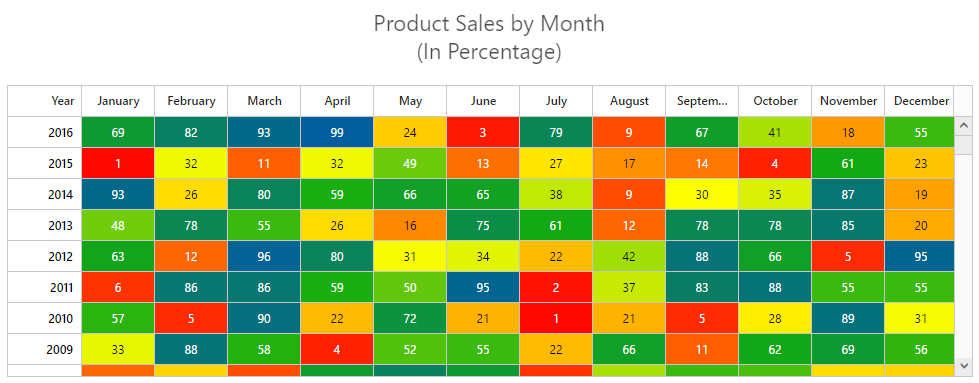
HeatMap chart is used for representing tabular data values as gradient colors instead of numbers. Low and high values are different colors with different gradients.
HeatMap chart provides support to configure a data source in two ways and map rows and columns to visualize.

Color mapping is used to indicate values as colors instead of numerical values. For example, if a heat map represents a data from 0 to 100, ColorMapping is used to specify colors for the lowest value and highest value. For any values between those, a medium color will be automatically chosen.

Legend is a control used to summarize the range of colors in the heat map. This gives a visual guideline for mapping between value and color.

The virtual scrolling support allows you to load data that you require (load data based on page size) without buffering the entire, huge database.

 Documentation
Greatness—it’s one thing to say you have it, but it means more when others recognize it. Syncfusion® is proud to hold the following industry awards.