Overview
End users can enable the following built-in features of the OLAP Grid either through UI or a simple user-friendly API in code-behind.
Conditional formatting
Allows users to define conditions that, when met, format the font, color, and border settings of values and summary cells.


Grid-style dialog
Used to format the cells of the control. Styling can be applied to column headers, row headers, summary cells, and value cells.
Freeze headers
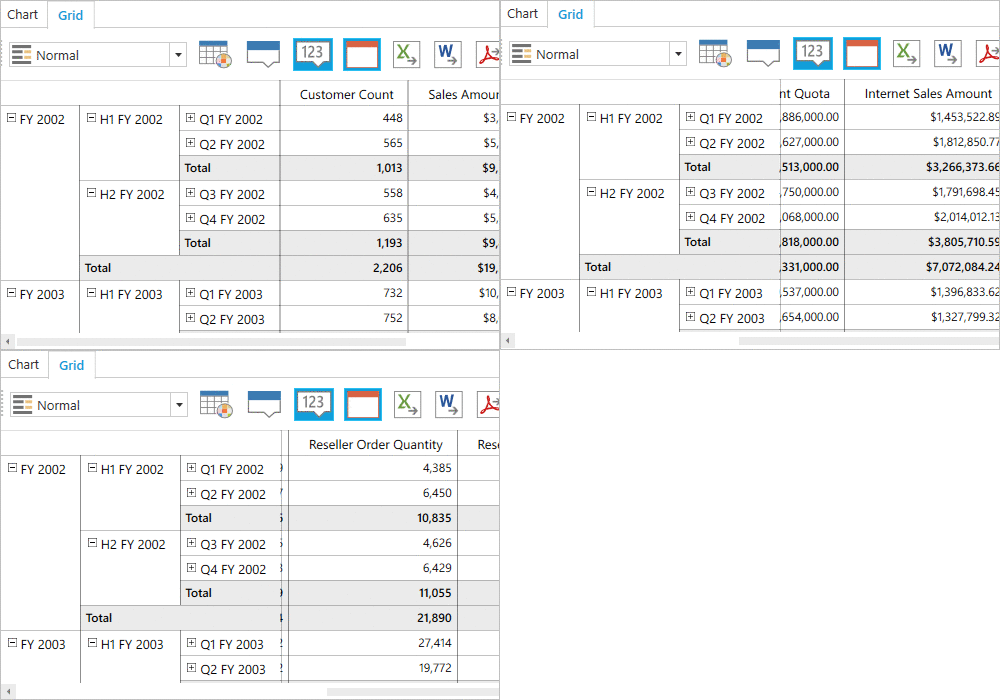
Users can freeze row and column headers while performing scroll operations to have a precise view of the content.


Hyperlinks
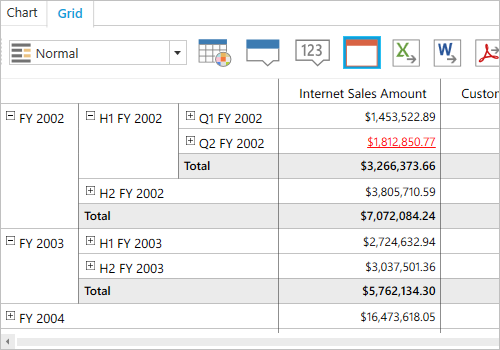
Help users retrieve information about a particular cell on clicking a hyperlink cell. This feature allows you to perform custom operations through code.
Drill-through
The drill-through feature obtains a list of raw items for a particular value cell or summary cell.

Visualization
Normal layout
The normal layout looks like the pivot table in earlier Excel versions, allowing end users to view the parent and child members adjacent to each other.

Summary layout
The summary layout easily switches the summary position either to the top or bottom beside each member in the control.

Excel-like layout
The Excel-like layout simulates the pivot table look and feel of Excel with child members positioned below their parent member with some indent space.

No summaries
The no-summaries layout hides the subtotal and grand total and shows only header and value cells.


Tooltip
Provides basic information about a value cell while the pointer hovers over it.
Exporting
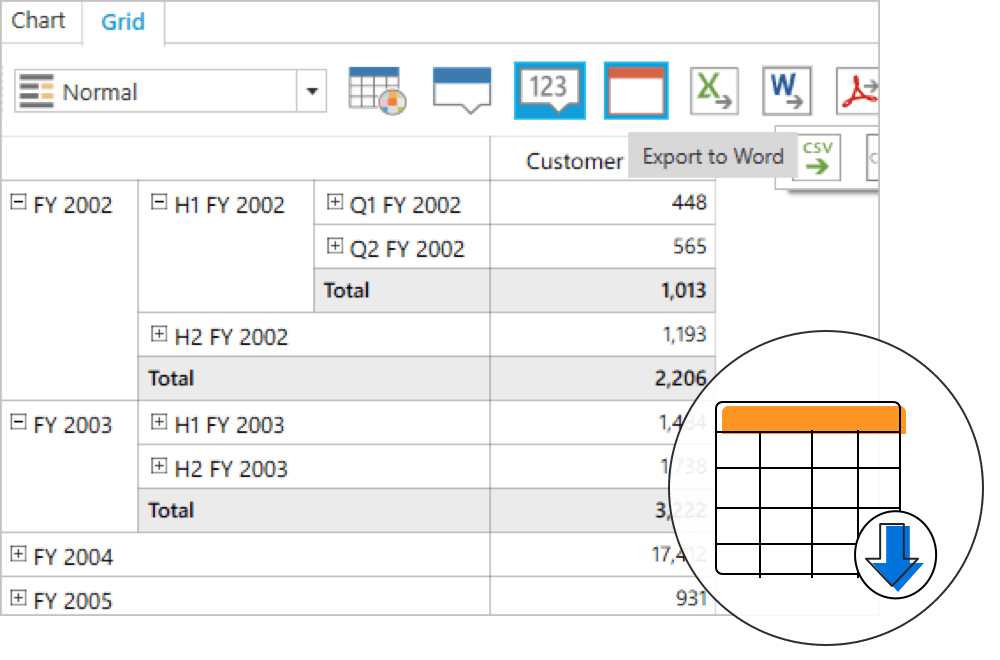
Export an OLAP Grid to Excel, Word, CSV, or PDF document. Several options are also provided to customize the exporting operations.

