Overview
The WPF Charts control displays thousands points of data in a few seconds and provides smooth interactions.
WPF Fast Line chart
A fast line chart is a special kind of line chart that can render a collection with a huge number of data points. Fast line is rendered using a polyline segment.

WPF Fast Line Bitmap Chart
Displays a series of line segments rendered using the WriteableBitmap. The advantage of the FastLineBitmapSeries is that it renders a million data points in a few seconds.

WPF Fast Column Chart
A fast column chart is used to boost the performance of the column series.

WPF Fast Bar Chart
A fast bar chart is used to boost the performance of the series.

WPF Fast Candle Chart
This chart renders using bitmap and displays each data point as a combination of a vertical column and a vertical line, like CandleSeries.

WPF Fast HiLo Chart
A fast HiLo chart represents a series of line segments with high and low values rendered using the WriteableBitmap.

WPF Fast OHLC Chart
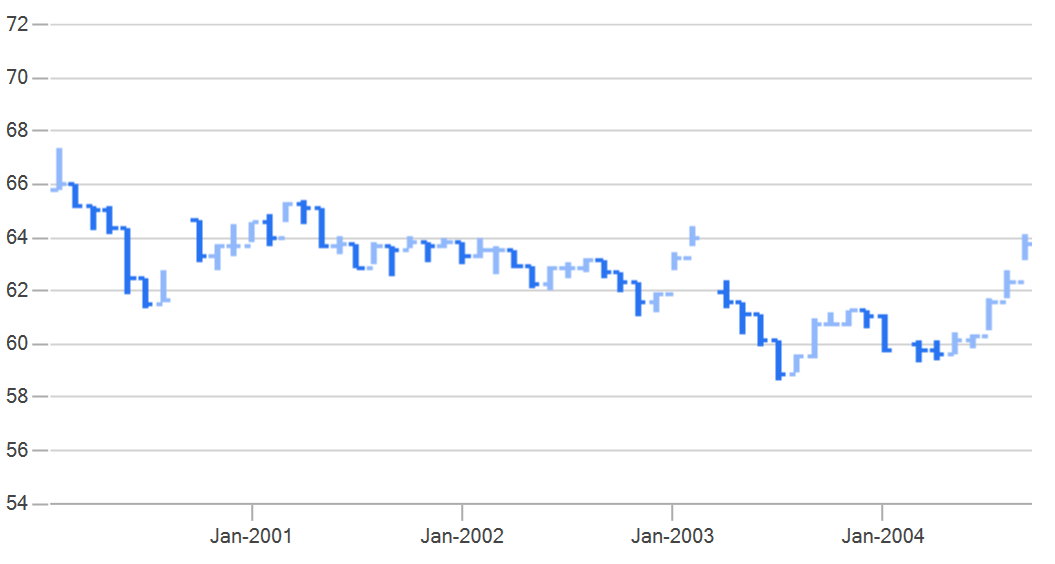
The fast OHLC charts are rendered using the WriteableBitmap, like other bitmap series.

WPF Fast Scatter Chart
A fast scatter chart is used to render a large number of scatter points.

WPF Fast Step Line Chart
A fast scatter chart is the high-performance version of stepline series.

WPF Fast Stacked Column Chart
A fast stacked column chart is similar to the stacked column series except that it loads faster and performs better.

WPF Fast Range Area Chart
A fast range area chart is the high-performance version of the range area series.

Our Customers Love Us


