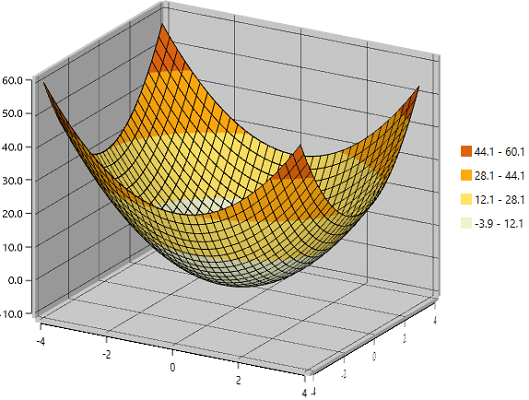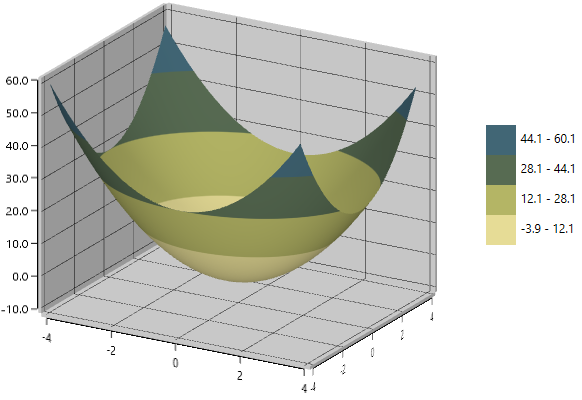
The WPF Surface Chart control is a high-performance, visually stunning, three-dimensional surface chart. It shows a three-dimensional surface that connects a set of data points.
The WPF Surface Chart supports data binding. You can display data in a grid table format.
The WPF Surface Chart covers the major types required in markets, like surface and contour, with respective wireframe combinations.

Surface charts are used to explore the relationships among three-dimensional data.

You can draw the wireframe or mesh for a surface chart.

Contours represent three-dimensional relationships in two dimensions.

You can draw the wireframe or mesh for the contour chart.
A surface axis is used to locate a data point inside the surface area.

Customize the look and feel of the default labels of WPF Surface Chart.

Define your own style for ticks in WPF Surface Chart.
A surface wall is used to create the three-dimensional view effect.

Define your own style for a wall with the help of the color and thickness properties.

You can hide the wall by setting a transparent color to the surface wall.
A color bar contains a set of colors that map to a range of values in a surface chart. A color bar can be docked around the plotting area, including its customizable labels and icons.

Change the type of color bar to built-in shapes such as circles, rectangles, crosses, or diamonds to improve readability of a chart.

Customize the positioning of the color bar to anywhere in the WPF Surface Chart.
You can adjust the default view to another direction by rotating the surface chart.

The WPF Surface Chart control supports gradient brushes.

The control comes with more built-in palettes and also supports custom palettes.

Easily get started with the WPF Surface Chart using a few simple lines of XAML or C# code example as demonstrated below. Also explore our WPF Surface Chart Example that shows you how to render and configure the XAML Surface Chart in WPF.
- <Window xmlns:syncfusion="clr-namespace:Syncfusion.UI.Xaml.Charts;assembly=Syncfusion.SfChart.WPF">
- <syncfusion:SfSurfaceChart />
- </Window>
- using Syncfusion.UI.Xaml.Charts;
- using System.Windows;
- namespace SurfaceChartExample
- {
- public partial class MainWindow : Window
- {
- public MainWindow()
- {
- InitializeComponent();
- SfSurfaceChart surface = new SfSurfaceChart();
- this.Content = surface;
- }
- }
- }
The Surface Chart shows a three-dimensional surface that connects a set of data points.- Support for a color bar.- Built-in palettes.- Support for gradient brushes.- Perspective and orthographic views.- Contour and wireframe support.- Simple configuration and API. - Extensive demos and documentation to help you learn quickly and get started with WPF Surface Chart.
No, this is a commercial product and requires a paid license. However, a free community license is also available for companies and individuals whose organizations have less than $1 million USD in annual gross revenue, 5 or fewer developers, and 10 or fewer total employees.
A good place to start would be our comprehensive getting started documentation.
 Documentation
Greatness—it’s one thing to say you have it, but it means more when others recognize it. Syncfusion® is proud to hold the following industry awards.