
Blazor 3D Chart is a graphical representation of data in three dimensions, showcasing relationships and trends among variables. Unlike traditional 2D charts, 3D charts add depth to the visualization, allowing for a more immersive and comprehensive understanding of data patterns.


The tooltip cursor allows users to interact with the chart and obtain detailed information about data points.

The Blazor 3D Chart supports legends, axis types, data labels, rotation, tilt, selection, and highlights.

The 3D charts have a highly responsive layout and an optimized design for desktops, touchscreens, and phones. They work well on all mobile phones that use iOS, Android, or Windows OS.

Cutting-edge design with several built-in themes, such as Material 3, Fluent, Tailwind CSS, Bootstrap, Material, and Fabric.

Users from different locales can use the control to format dates, currency, and numbers to suit their preferences.

The 3D Chart for Blazor provides fluid animation to present data with smooth transitions.
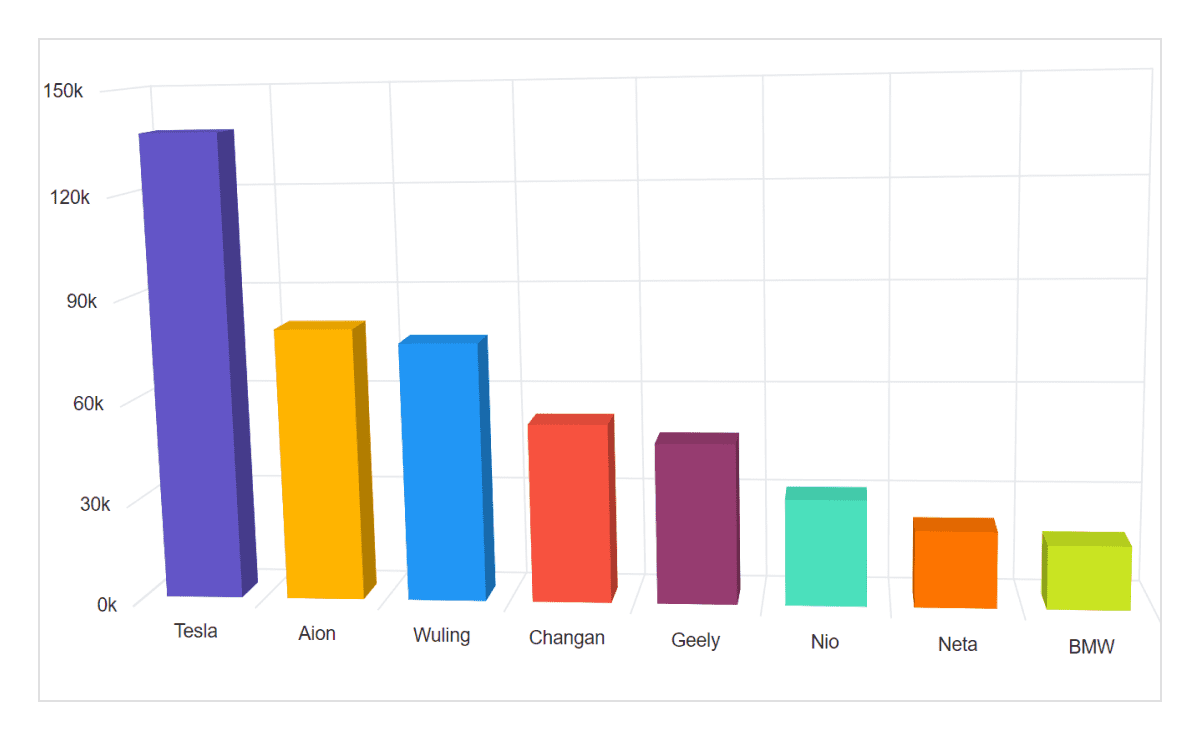
Easily get started with the Blazor 3D Chart using a few simple lines of C# code as demonstrated below. Also, explore our Blazor 3D Chart Example that shows you how to render and configure 3D Charts in Blazor.
- @using Syncfusion.Blazor.Chart3D
-
- <SfChart3D>
- <Chart3DPrimaryXAxis ValueType="Syncfusion.Blazor.Chart3D.ValueType.Category"></Chart3DPrimaryXAxis>
- <Chart3DSeriesCollection>
- <Chart3DSeries DataSource="@DataSource" XName="X" YName="Y" Type="Chart3DSeriesType.Column" />
- </Chart3DSeriesCollection>
- </SfChart3D>
-
- @code{
- public class ChartData
- {
- public string X { get; set; }
- public double Y { get; set; }
- }
-
- public List<ChartData> DataSource = new List<ChartData>
- {
- new ChartData { X= "Tesla", Y = 13 },
- new ChartData { X= "Aion", Y = 8 },
- new ChartData { X= "Wuling", Y = 17 },
- new ChartData { X= "Changan", Y = 25 },
- new ChartData { X= "Geely", Y = 17 },
- new ChartData { X= "Nio", Y = 15 },
- new ChartData { X= "Neta", Y = 22 },
- new ChartData { X= "BMW", Y = 18 },
- };
- }
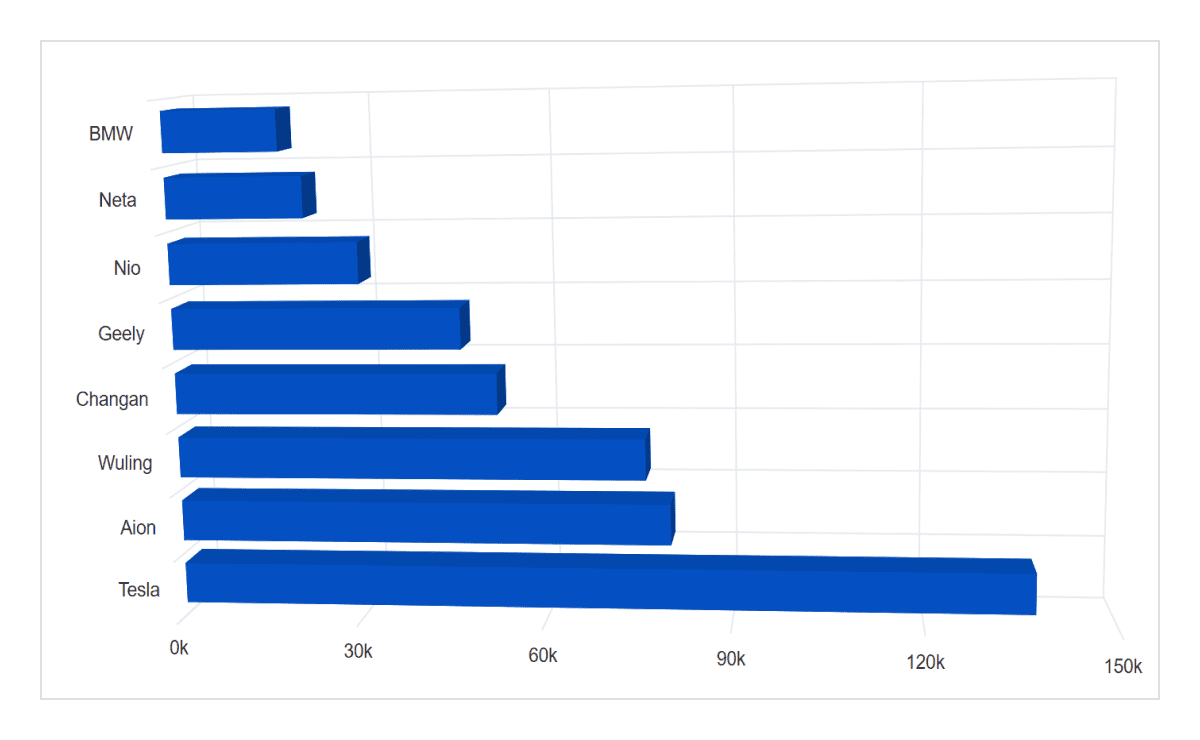
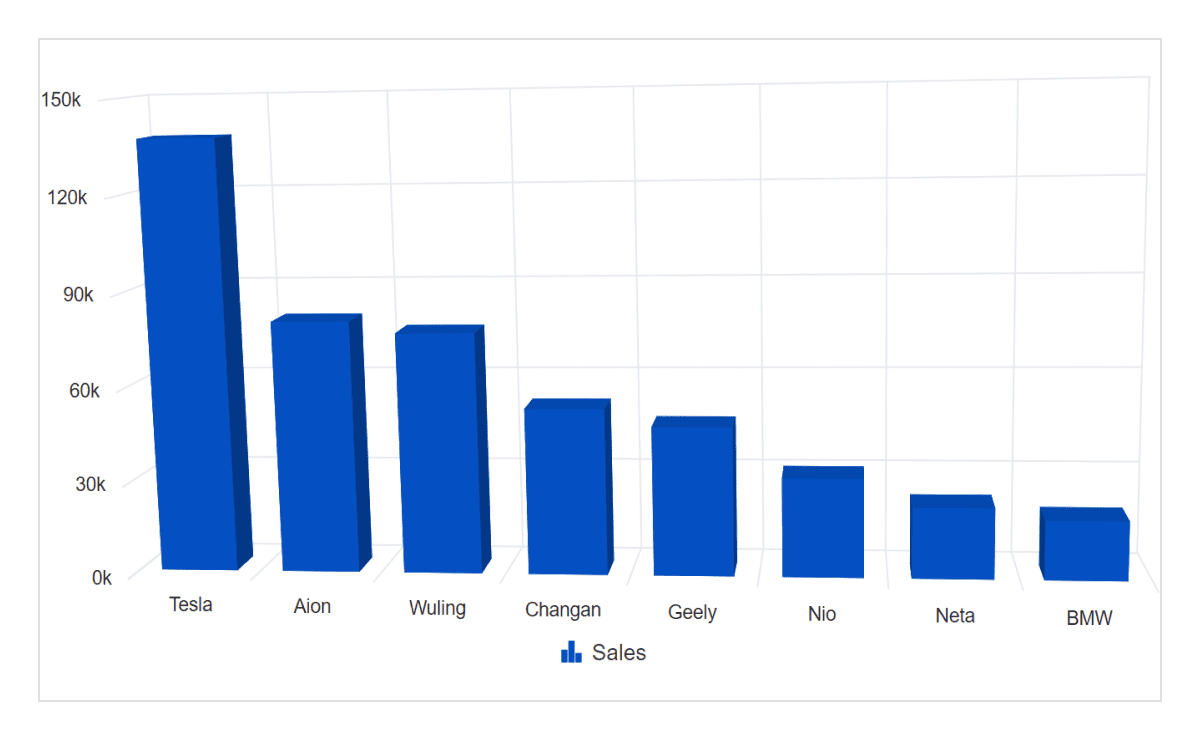
The 3D charts can plot over six chart types, including column, bar, stacking column, stacking bar, 100% stacked column, and 100% stacked bar.
The 3D charts support legends that provide additional information about a series with customization options.
The 3D chart control provides options to display tooltips with details about pointer values on mouse hover.

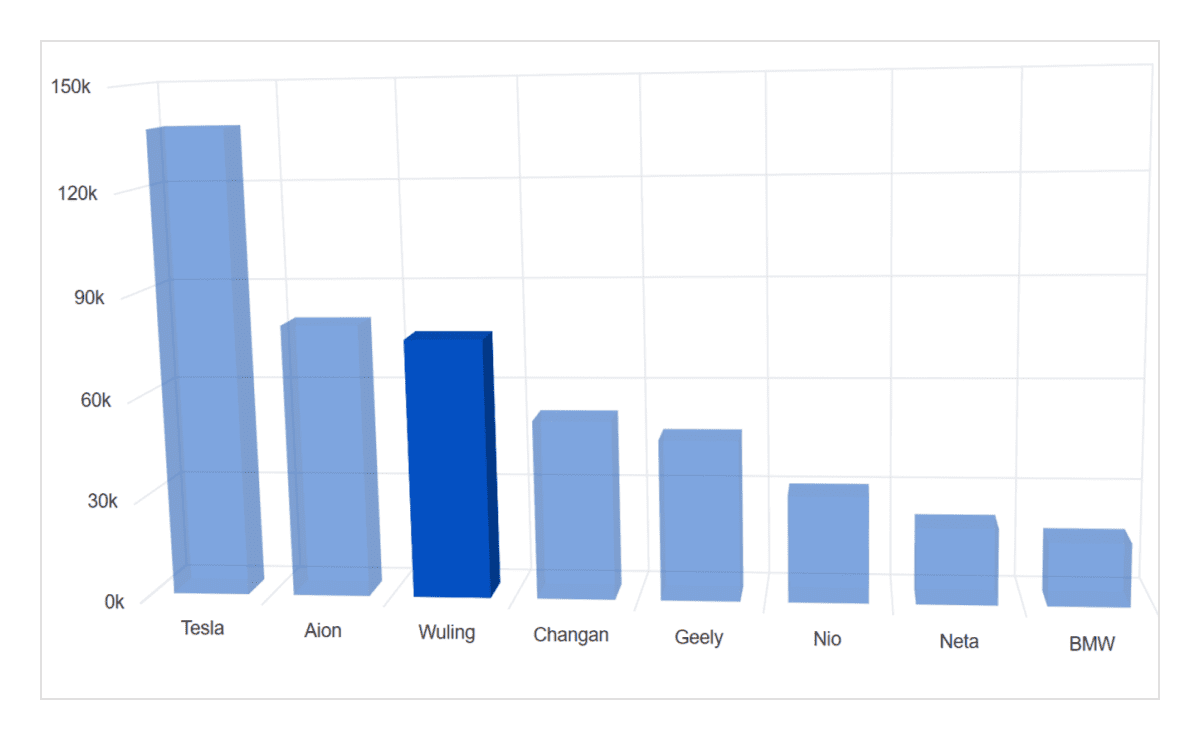
Select or highlight data points in a series for easy understanding of the selected data. Adding pattern and color to the selected data makes charts more interactive.
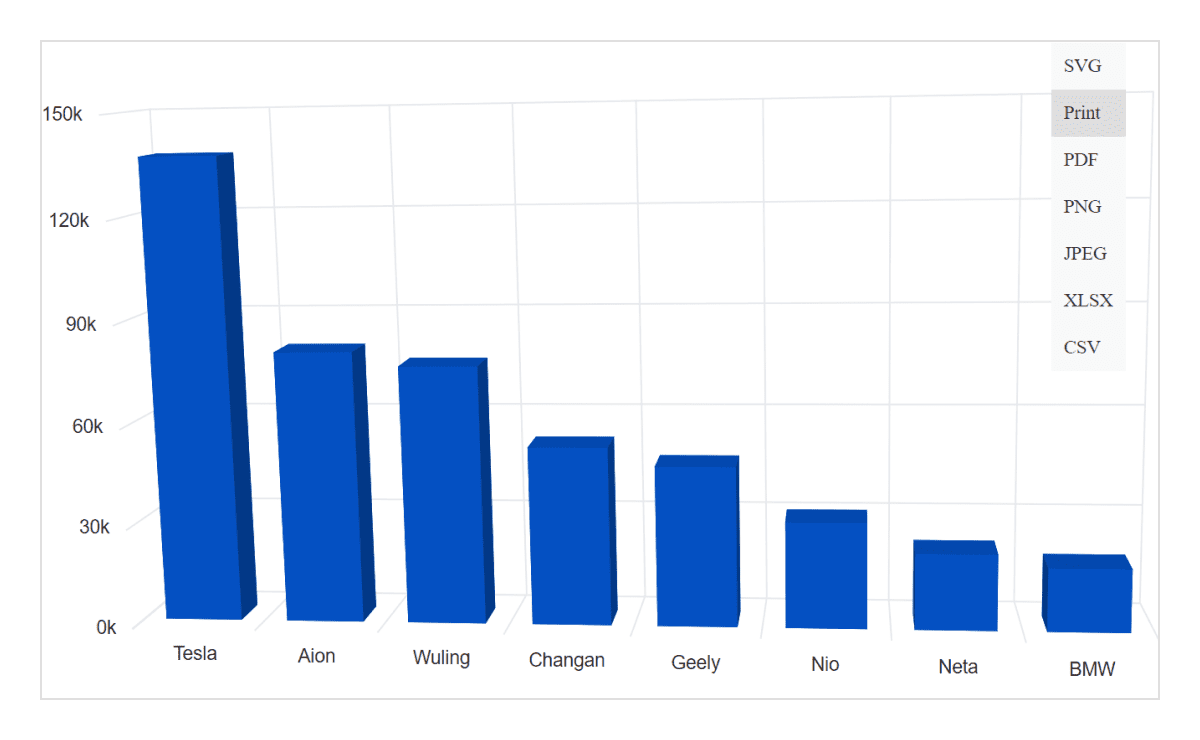
Export Blazor 3D Charts to PDF documents or to image formats such as PNG and JPEG on the client side. Print the rendered 3D charts and graphs directly from the browser.
The 3D charts can plot different data types such as numbers, datetime, logarithmic, and string. The chart’s axis elements can be customized further to make an axis more readable.
The 3D charts support data labels to annotate points to improve the readability of data.
Customize the color of data points, the depth of the wall, and the wall color of the 3D charts using built-in APIs.
Plot multiple series in a single chart to compare different data values. Enabling legends and tooltips provides more information about individual series.


The end-user experience is greatly enhanced by including a set of interactive features such as rotation, tilt, selection, and highlight.

Every element in the Blazor 3D Chart is keyboard accessible. Major features like tooltips, legends, selection, and highlights can be used with keyboard commands alone. No mouse interaction is required. This helps in creating highly accessible applications.

The Blazor 3D Charts view has complete WAI-ARIA accessibility support. The 3D chart’s UI includes high-contrast visual elements that help visually impaired people to have the best viewing experience. Also, valid UI descriptions are easily accessible through assistive technologies such as screen readers.

Right-to-left rendering allows displaying the text and layout of 3D charts from right to left. This improves the user experience and accessibility for RTL languages.

The Blazor 3D Charts with a rich set of features offers the following:
We do not sell the Blazor 3D Charts separately. It is only available for purchase as part of the Syncfusion team license. This contains over 1,900 components and frameworks, including the Blazor 3D Charts. The price of the team license starts at $395 per month for 5 developers, and includes support and updates until the subscription expires. In addition, we might offer discounts based on currently active promotions. Please contact our product specialists today to see if you qualify for any additional discounts.
You can find our Blazor 3D Charts demo, which demonstrates how to render and configure 3D Charts.
No, our 1,900+ components and frameworks for web, mobile, and desktop, including our Blazor Charts, are not sold individually. They are only available as part of a team license. However, we have competitively priced the product, so it only costs a little bit more than what some other vendors charge for their Charts component alone. We have also found that, in our experience, our customers usually start off using one of our products and then expand to several products quickly, so we felt it was best to offer all 1,900+ components and frameworks for a subscription fee that starts at $395 per month for a team of 5 developers. Additionally, we might be able to offer discounts based on currently active promotions. Please contact our product specialists today to see if you qualify for any additional discounts.
No, this is a commercial product and requires a paid license. However, a free community license is also available for companies and individuals whose organizations have less than $1 million USD in annual gross revenue, 5 or fewer developers, and 10 or fewer total employees.
A good place to start would be our comprehensive getting started documentation.


 Documentation
Greatness—it’s one thing to say you have it, but it means more when others recognize it. Syncfusion® is proud to hold the following industry awards.


