Trusted by the world’s leading companies

Overview
The ASP.NET MVC Pivot Table control, written in jQuery, organizes and summarizes business data and displays the result in a cross-table format.
Data binding
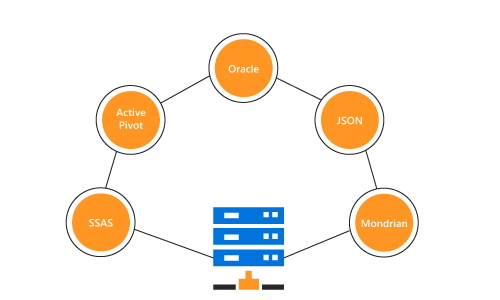
The ASP.NET MVC Pivot Table simulates the pivot table feature of Excel. The data source for the control can be an OLAP or pivot data source.
- OLAP Data Sources: Supports SSAS, Mondrian, ActivePivot and Oracle.
-
Pivot Data Sources: Supports DataTable, DataView, DataSet from SQL databases or collections like IEnumerable, ICollection, IList, List
and ArrayList.
Optimized for mobile devices

Touch support
All the features work smoothly on desktop and tablet devices. Features such as drill up and drill down, filtering, sorting, and report manipulation can be done on the fly.

Responsive support
The responsive support allows the control layout to be viewed on desktop and tablet devices.
OLAP
End users can easily slice and dice the OLAP cube elements of their choice to visualize performance, trends, outliers, and more.

Slice and dice
With slice and dice, you can create a new view for end users by selecting dimensions and measures from the OLAP cube and filtering them.

KPIs
The KPIs are a collection of calculations associated with a measure group that evaluates business success.

Paging
Extensive support has been provided to load and render large amounts of data without any performance constraints through paging or virtual scrolling.

Named sets
Named sets simplify MDX queries and provide useful aliases for complex, commonly used set expressions.

Calculated members and measures
You can create and display dimensions and measures on your own.
Pivot table field list
The pivot table field list, also known as the pivot schema designer, is a powerful tool that allows you to create and manage a pivot table with either multidimensional or pivot data sources. End users can drag fields and filter them at runtime to create pivot reports as needed.

Grouping fields
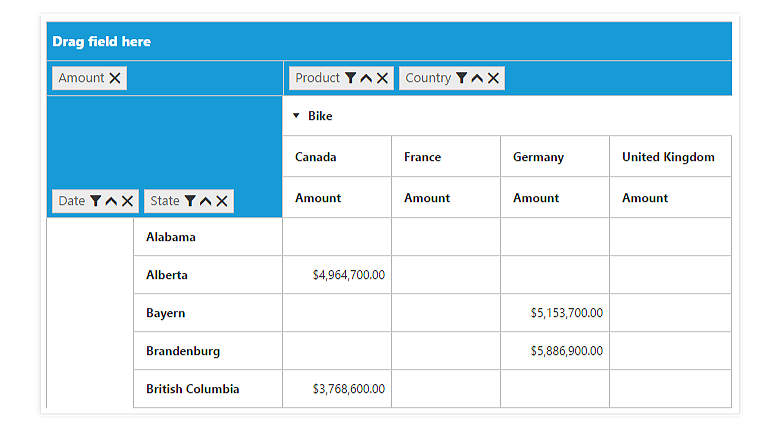
Group fields, also known as grouping bar is automatically populated with fields from the bound data source. It allows end users to drag fields, filter and sort them, and alter the pivot report at runtime.
Drill down and drill up
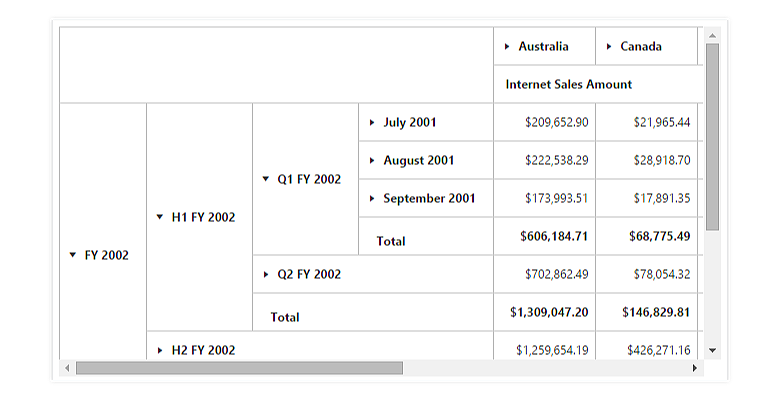
Built-in support for drill down (expand) and drill up (collapse) to visualize the grid information in both abstract and detailed views.

Defer update
Users can refresh the control on demand instead of during every UI interaction in ASP.NET MVC Pivot Table.
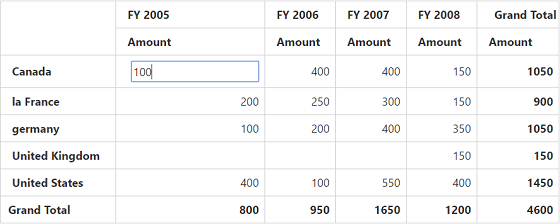
Editing and updating
Users can edit values at runtime and save their changes to the underlying data source, thereby reflecting the update in all the cells.
Filtering
Built-in header and Excel-like filter UIs with advanced filtering options to easily filter and view data as required. It is also possible to filter by code-behind.
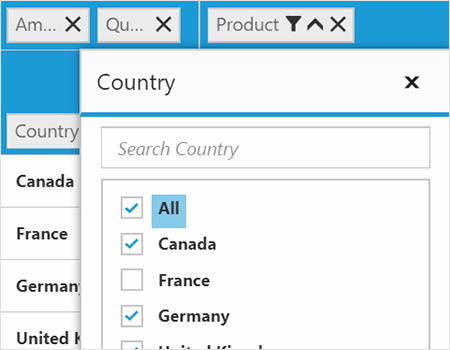
Header filtering
Displays only select values for a field. It can be achieved either through the UI or code-behind.
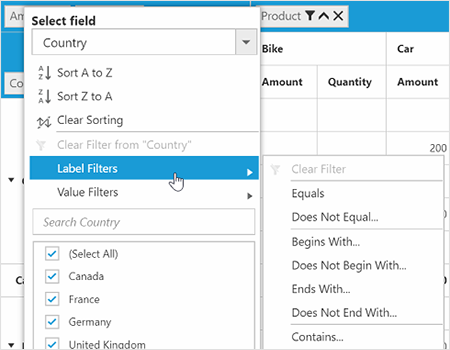
Excel-like filtering
An advanced option to filter column and row headers based on label text or grand-total values.
Sorting
Sorting supports ordering rows and columns based on labels or values.
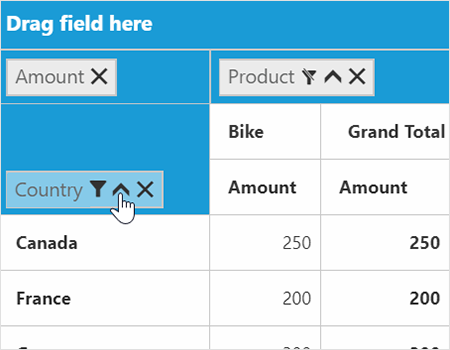
Header sorting
Orders the column and row header text in ascending or descending order.
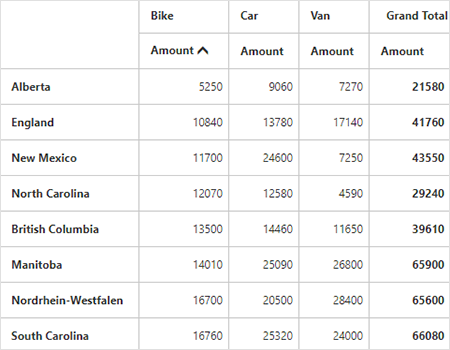
Column sorting
Column sorting, also known as value sorting, orders the column values in ascending or descending order. It is performed by clicking the column header.
Summaries and calculations

Summaries
Provides extensive support for you to define your own custom summaries, plus 10 built-in summary types. You can apply this only for pivot data sources and perform though reports in code-behind.

Calculations
Allows inserting new calculations at runtime and features 16 built-in calculation types. You can apply this only for pivot data sources and perform though reports in code-behind.
Calculated fields
The calculated field, otherwise known as unbound field generates unique field with our own calculated value by executing a simple user-defined formula. This functionality is applicable only for pivot data sources.
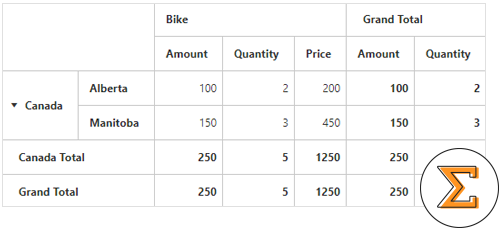

Expression fields
Expression fields generate data by executing a user-defined expression. The generated data is specific to a few fields from the underlying data source. You can apply this only for pivot data sources and perform though reports in code-behind.
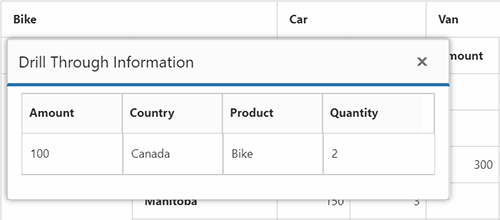
Drill through
The drill-through feature easily obtains a list of raw items for a particular value cell or summary cell.
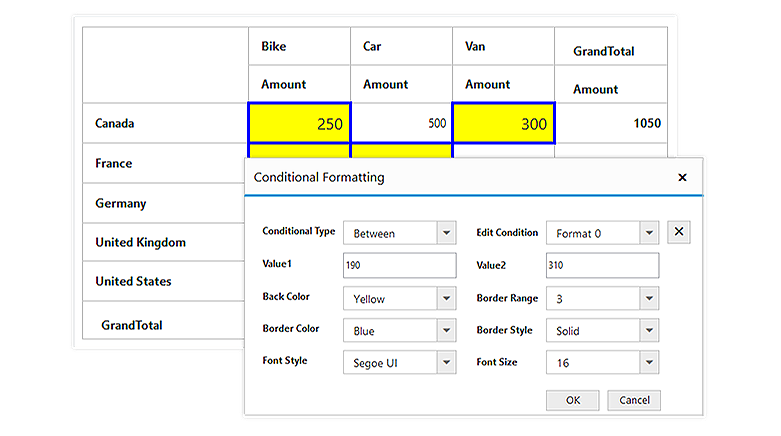
Conditional formatting
Allows users to define conditions that, when met, format the font, color, and border settings, of values and summary cells.
Number formatting and date formatting
Number formatting and date formatting helps to transform the appearance of the actual cell value. This functionality is applicable only for pivot data sources.
Totals
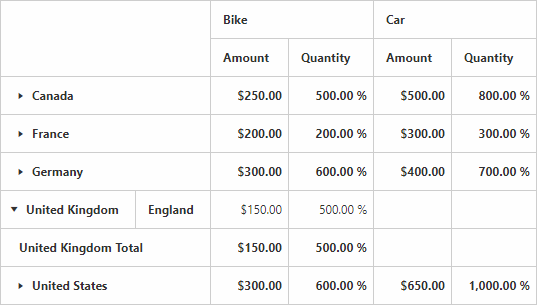
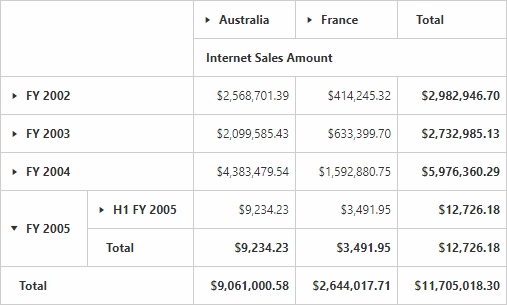
The subtotals and grand totals are calculated automatically by the pivot engine, inside and displayed in the pivot grid. It helps users to make decision based on the totals. Also, user can show or hide subtotals and grand-totals for rows and columns.
Columns and rows
Hyperlink
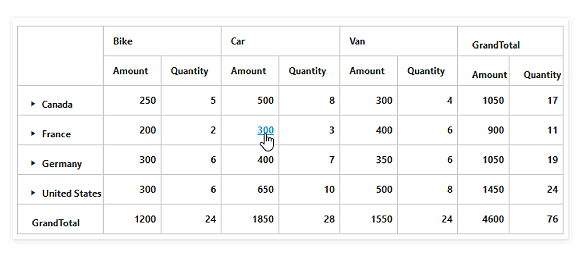
User can retrieve information about a particular cell on hyperlink cell click. It later allows you to perform custom operations programmatically.
Cell context
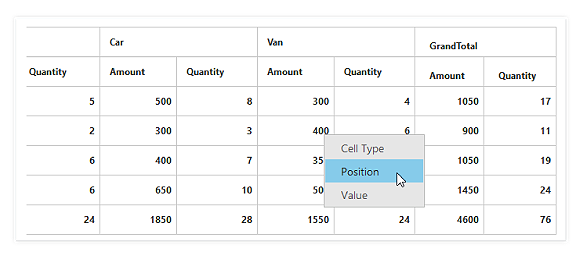
You can perform custom operations in code-behind on right-clicking a cell. For example, a context menu or dialog can be created or invoked on right-clicking.

Selection
Provided extensive support for selecting a range of value cells.

Tooltip
It provides basic information about a cell while hovering over it with the pointer.
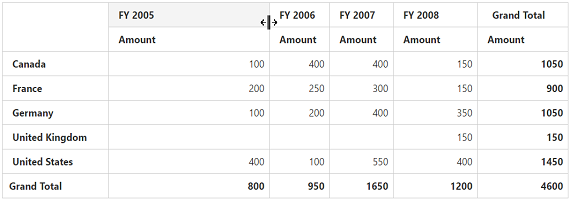
Column resizing
You can easily resize each column’s width with a simple drag operation at runtime.
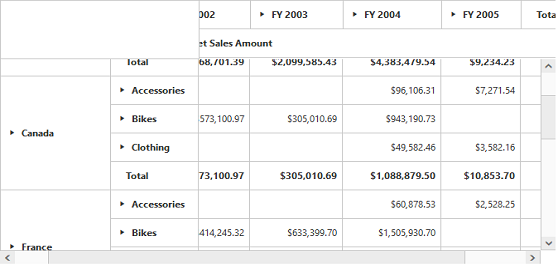
Freeze headers
Users can freeze row and column headers while performing scroll operations to have a precise view of the content.
Save and load reports
You can save reports from the current session as a stream in a database for later use.

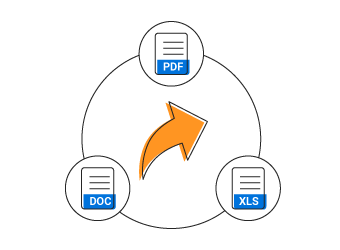
Exporting
You can export a ASP.NET MVC Pivot Table to Excel, Word, and PDF documents.
Custom style and themes

Built-in themes
Ships with a set of 13 stunning, built-in themes namely azure, lime and saffron in light, dark and gradient patterns.

Custom Styling
The appearance the control can be customized to any extent.

Theme studio
Easily customize all aspects of the control’s appearance using the Theme Studio utility.
Developer friendly API
For a great developer experience, flexible built-in APIs are available to define and customize the ASP.NET MVC Pivot Table control. Developers can optimize the data bound to the control and customize the user interface (UI) completely using code with ease.
Web accessibility
Our ASP.NET MVC Pivot Table has been developed to make it possible for people with disabilities to use and interact with the control.

Globalization and localization

Globalization
Allows users from different locales to use the control by applying appropriate date formats, currency formats, and number formats.

Localization
The pivot grid allows users to customize the text in the user interface based on the local culture.

Right-to-left (RTL)
The text direction and layout of the pivot grid control can be displayed from right-to-left(RTL) direction.
Cross-browser and cross-platform
The ASP.NET MVC Pivot Table will work on all major browsers across Windows and macOS. It is written in jQuery to provide the same working experience on popular browser like Chrome 17+, Firefox 22+ and Internet Explorer 8+. It also works with various platforms like ASP.NET, ASP.NET Core, TypeScript, PHP and JSP.
Third party framework support
The ASP.NET MVC Pivot Table control has built-in integration with popular third-party frameworks such as Angular, React, Ember, and Aurelia. Check out the control unique features for each platform.
85+ ASP.NET MVC UI CONTROLS
Awards
Greatness—it’s one thing to say you have it, but it means more when others recognize it. Syncfusion® is proud to hold the following industry awards.


