Trusted by the world’s leading companies

Overview
Linear gauge has been used to identify the quantitative value in analog format. It is rendered as a canvas image. By using the linear gauge control, it is possible to render the thermometer.
Orientation
Linear gauges can be positioned either in a vertical or horizontal orientation, according to the user’s required scenarios.


Appearance
The appearance of each element of a linear gauge, such as its state indicators, pointers, scale intervals, pointer positions, label positions, tick positions, and much more, is easily customizable.
State Indicator Styles
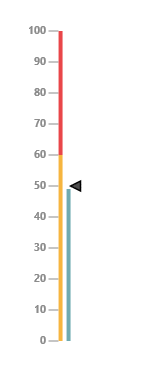
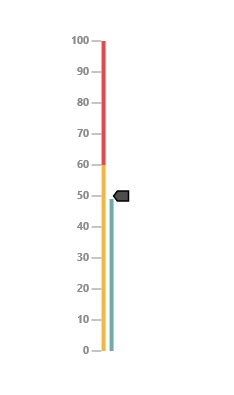
The main purpose of the state indicator styles available within the linear gauge is to indicate the current state of the gauge, based on its current value. Each state may be indicated with different specific colors.


Label Format
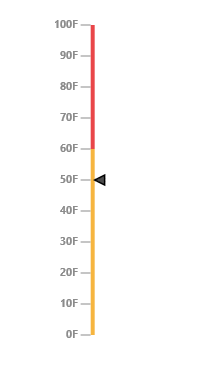
Linear gauge provides various formatting options for labels to be displayed in any desired format. For instance, the percent symbol can be appended to the default labels to denote the percent values.
Range Indicators
Gauge supports range indicators that can be used to highlight each specific range within a gauge scale with a different color. The users can specify their required start and end values for each range indicator within the gauge. They can also be located at different positions — such as cross (across the scale), inside (below the scale), and outside (above the scale).


Export
Gauge provides support for exporting a gauge control into various image formats. Linear gauges can be exported into formats such as .jpg, .bmp, or .gif.
85+ ASP.NET MVC UI CONTROLS
Awards
Greatness—it’s one thing to say you have it, but it means more when others recognize it. Syncfusion® is proud to hold the following industry awards.


