Overview
A timeline is used to represent the project duration as individual cells with defined units and formats. It displays project tasks in chronological order with progress, tasks dependencies, and more.

Tier Layout
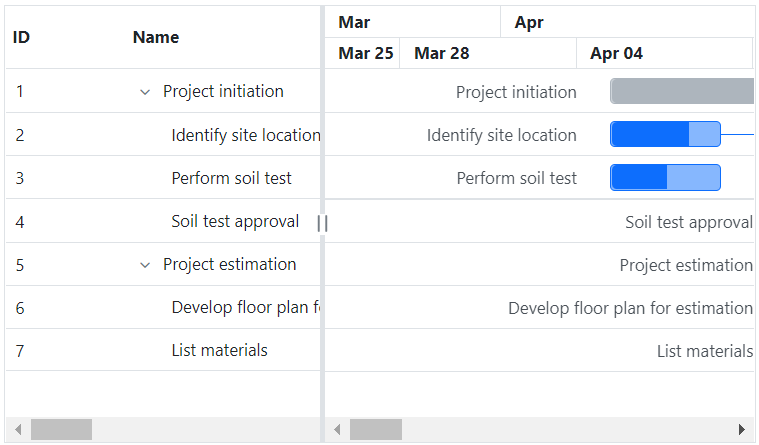
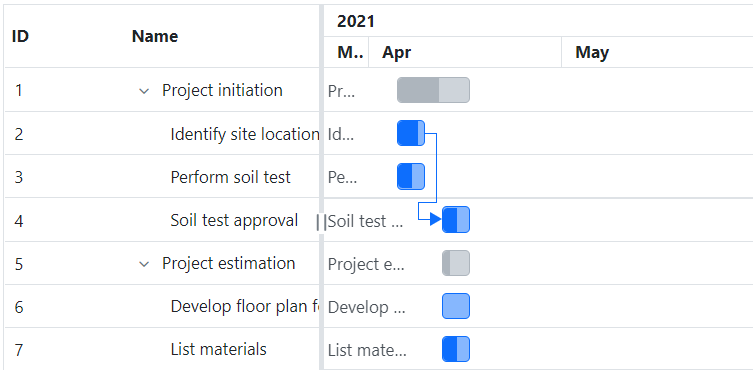
The Blazor Gantt Chart component has a two-tier layout: top tier and bottom tier. The two tiers allow users to view two different timescales at once. The units and labels of both tiers are customizable to meet any application requirement.
Timeline modes
The Blazor Gantt Chart timeline supports various built-in view modes modes: hour, week, month, and year. Modes are chosen based on the timescale of the project.

Zooming
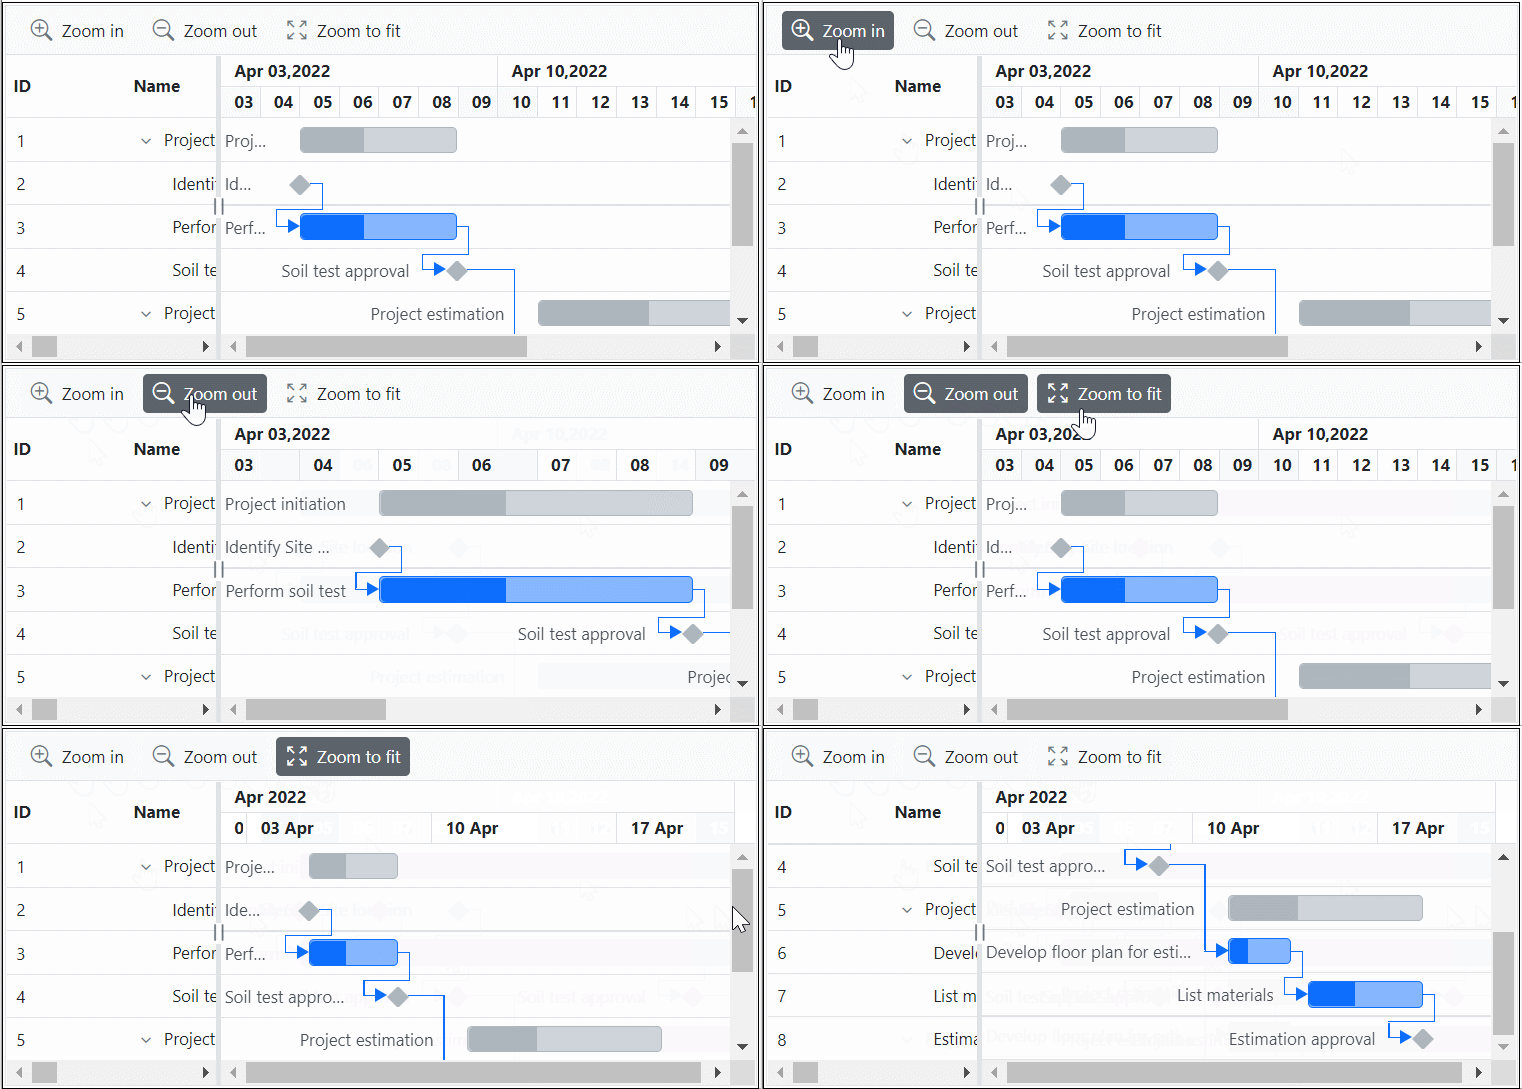
Users can view the tasks in a project clearly in timespans from minutes to years using built-in zooming actions. Also the zoom-to-fit option allows users to view all the tasks in a single view port.
Working days and holidays
Nonworking days such as holidays and weekends can be customized. Working hours in a day for a project can be defined. This helps users keep track of each task and resource task status based on the working time of the company.
Event markers
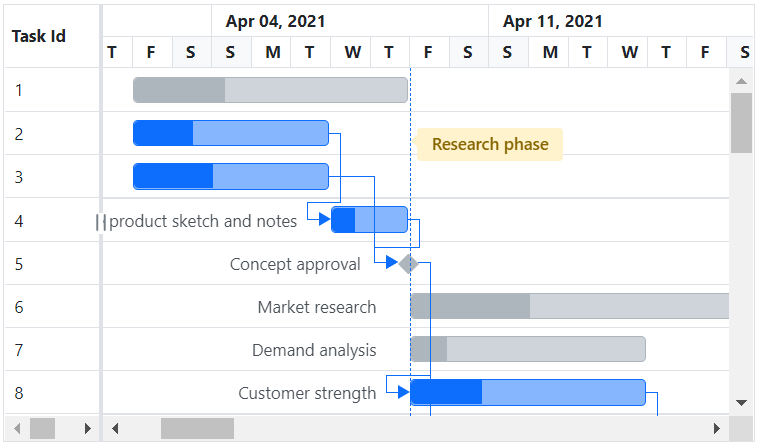
Highlight important events in a project. For all the tasks in a project or a particular task, an event can be highlighted to indicate an important activity or day.

Our Customers Love Us


