Trusted by the world’s leading companies

Overview
The JSP Maps control is a powerful data visualization tool that can be used to articulate data as a map. By using the Maps control, visualize various maps like sales map, political boundaries map, weather map, electoral map, route map, travel tracker, and much more. It is frequently used in financial dashboards for plotting sales across geography.
GeoJSON
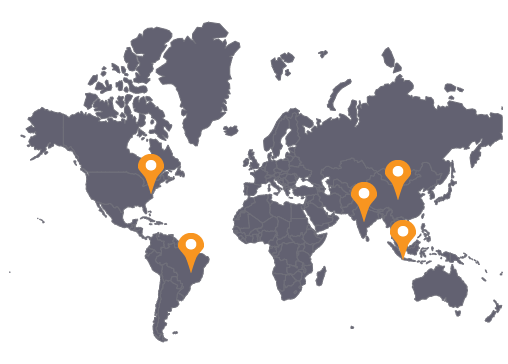
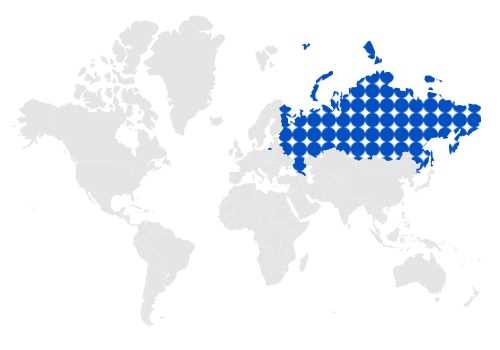
Bind GeoJSON data to the maps to render any geometric shape in SVG (Scalable Vector Graphics) for powerful data visualization of shapes. For example, you can render world map or US map and customize it to the desired look using built-in options in the JSP Maps control. You can also add any number of layers to the maps.
Geo-imagery visuals
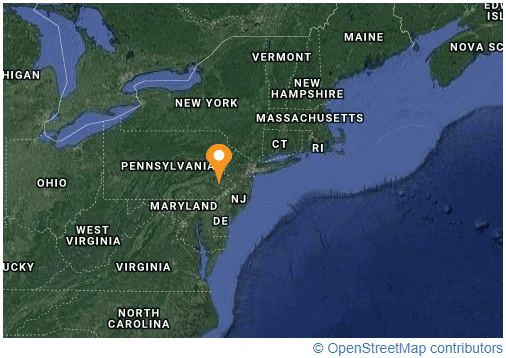
Built-in support for external geospatial imagery services, such as Bing maps and OpenStreetMap, is used to visualize satellite, aerial, and street maps, or other kinds of imagery tiles without any external shape inputs. Apart from Bing maps and OpenStreetMap, you can also render maps from various map providers, like, Google Maps. By using external services, the map data can be located easily.
Multilayers
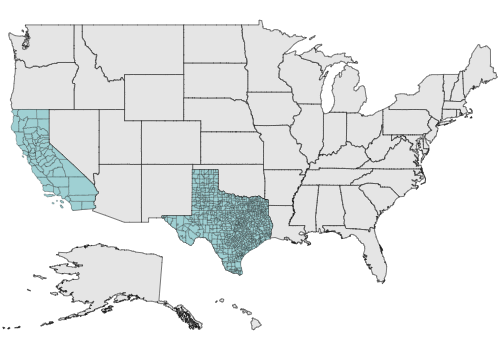
Using sublayer, you can create a map with multiple geometric layers in a single view. For example, render additional geographic features of a country such as rivers, valleys, and more as a sublayer. You can also drill each layer.
Marker
You can denote a place with symbols or mark messages at the desired latitude and longitude of a location on a map using markers. For example, you can indicate a particular place on the US map using a balloon marker shape. Place any HTML element as a marker and also add multiple markers to the map.
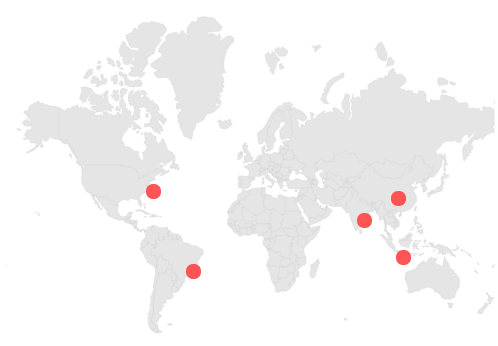
Data label
Data labels on the maps provide identification for the shapes by displaying their names. Hide the labels if they exceed shape bounds.
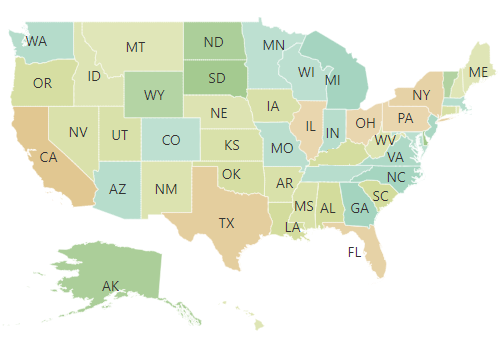
Bubble
Create a simple map with bubbles to denote additional information about shapes such as population density, land area, and more. Bubbles are rendered with various magnitudes and colors based on the underlying data values of the shape.
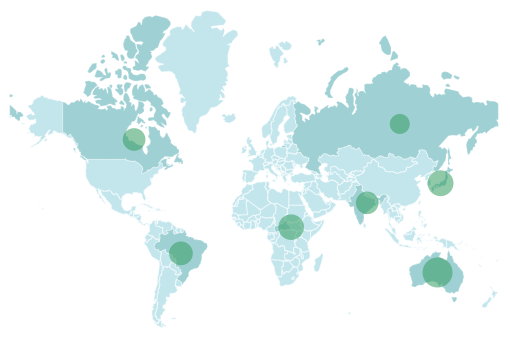
Color mapping
Categorize the shapes on a map by customizing their colors based on the underlying value or by comparing their value with a desired numeric range. For example, apply colors to the states in the US based on population density.
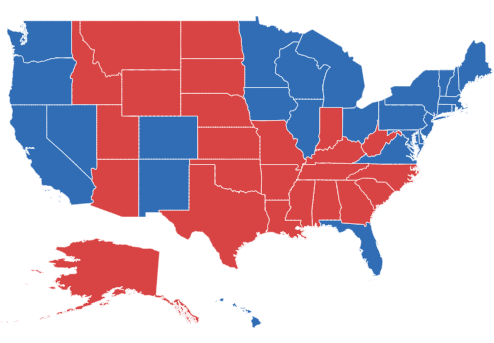
Legend
You can use legends to provide valuable information for interpreting the map with various colors, shapes, or other identifiers based on data and application needs. The JSP Maps control supports two types of legends: Default and interactive.
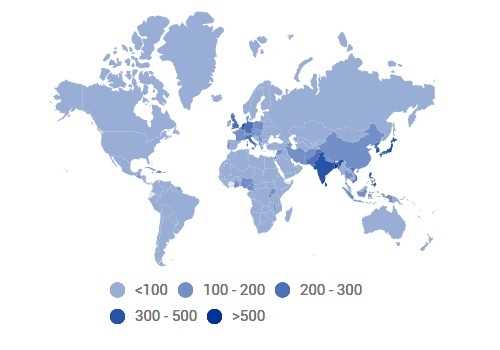
Default
A map with legend contains swatches of symbols with descriptions to denote the categories of shapes.
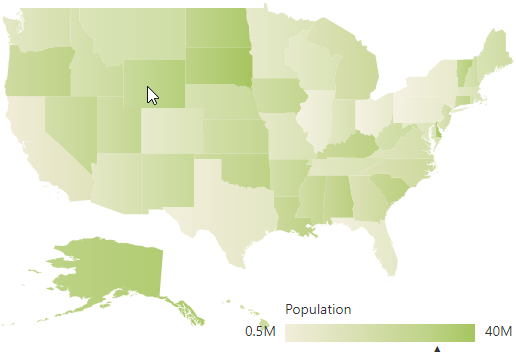
Interactive
Use a map with an interactive legend to find the range of an underlying shape’s value on mouse hover.
Zooming and panning
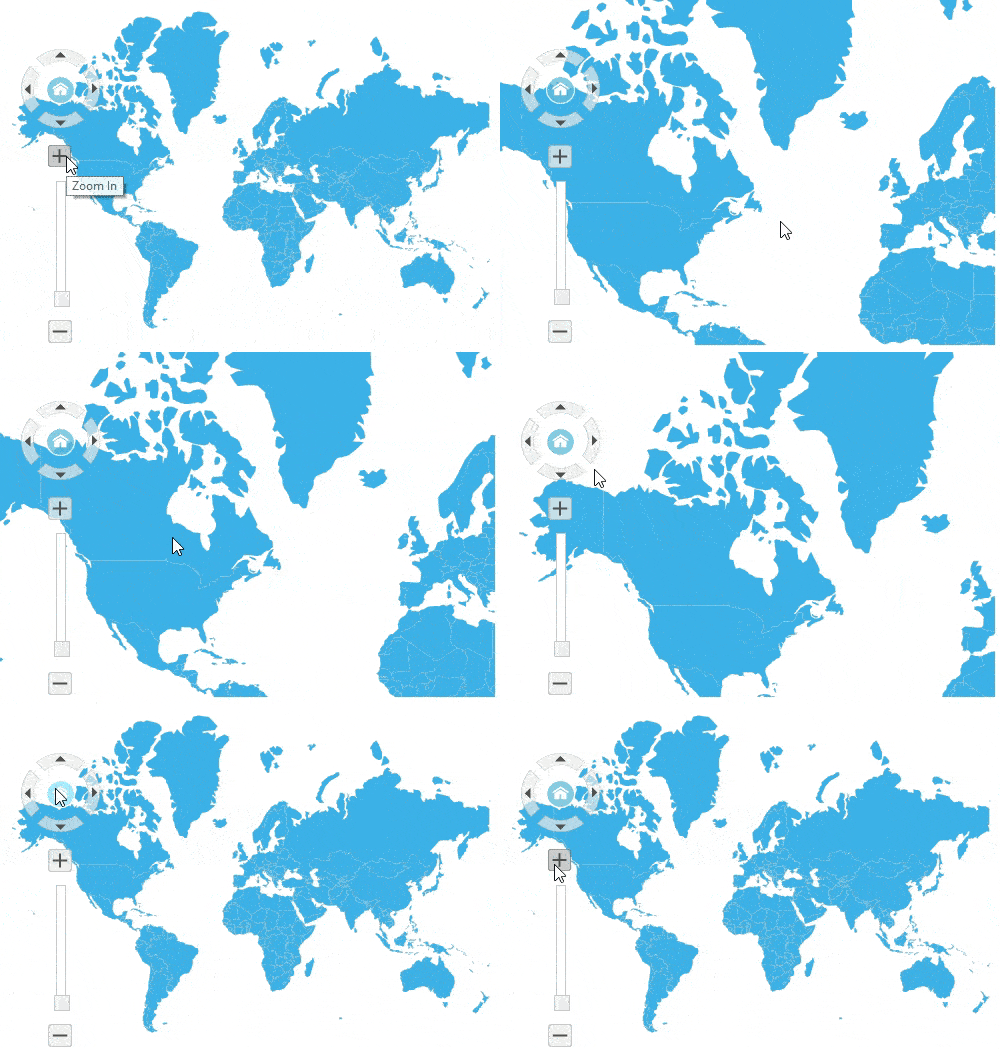
Zoom the map for close-up analysis by scrolling the mouse wheel, clicking the shapes, or by using navigation control; and pan the map for easy navigation across regions. You can also change the zoom level on initial rendering.
Tooltip
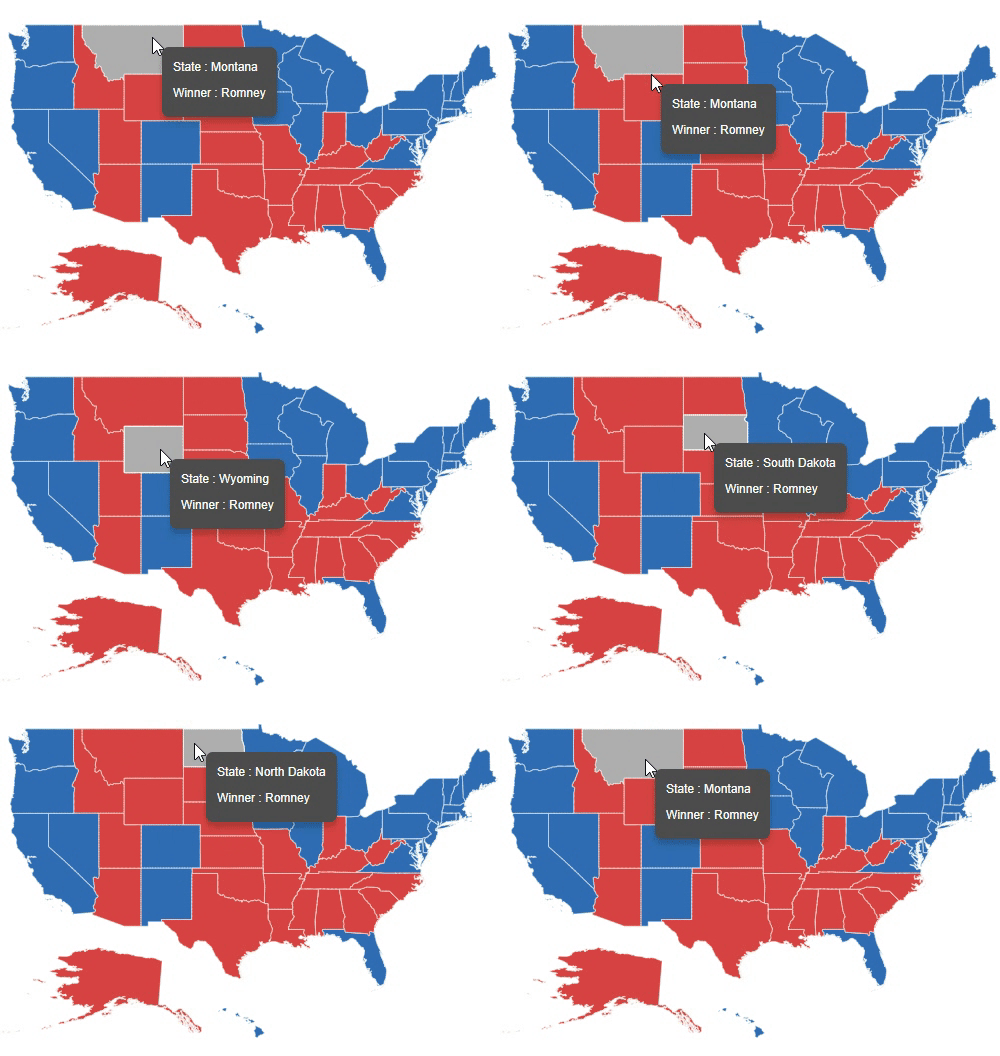
The JSP Maps control displays the details about the shape value using a tooltip by hovering the mouse over the shape.
Drill-down
You can drill-down the rendered maps to display a different shape data located on another layer. For example, in the initial layer you can render the world map and on clicking a particular continent, render it separately on another layer.

Selection and highlight
Select a particular shape on mouse click and highlight on mouse hover to bring the center of attraction over other shapes on a map.
Custom shapes
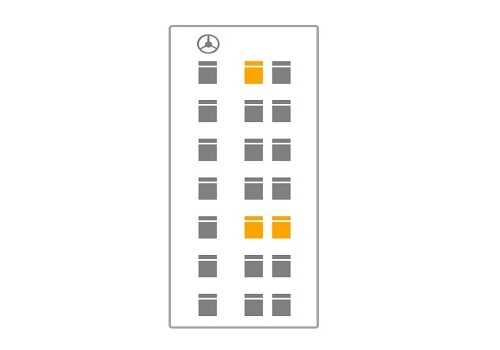
Create a map with custom shapes by rendering your own GeoJSON data to indicate building infrastructure, points of interest, flight/bus seat arrangement, cricket stadium, and more useful information.
Appearance
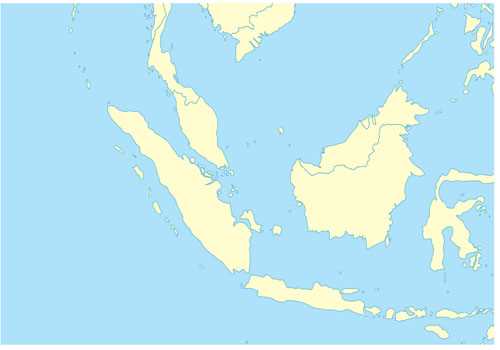
Customize the look and feel of a map by changing the fill color, background, border, and opacity of shapes. Almost all the elements in the Maps are customizable. The JSP Maps control also provides built-in palettes with customizable options, by default.
Touch and responsive support
The interactive JSP Maps control also supports touch interactions.

Touch support
All the features of Maps will work on touch devices with zero configuration. Use the touch features such as tooltip, drill-down, selection, highlight, and single tap zoom without any customization.
Responsive
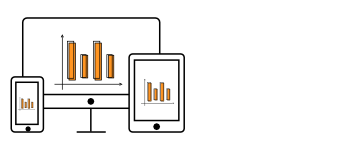
You can view Maps widget on various devices. You can also hide specific elements in the maps for particular screen sizes by making very minimal changes to the map events.
Cross-browser support
You can render the Maps component in all the modern browsers.
60+ JSP CONTROLS
Awards
Greatness—it’s one thing to say you have it, but it means more when others recognize it. Syncfusion® is proud to hold the following industry awards.
