
The Vue HeatMap Chart is a graphical representation of two-dimensional data where values are represented with gradient or solid color variations. The data points are rendered as HeatMap cells using Scalable Vector Graphics (SVG) or canvas UI rendering.
Easily get started with the Vue HeatMap Chart using a few simple lines of HTML code, as demonstrated below. Also explore our Vue HeatMap Chart example that shows you how to render and configure the HeatMap Chart in Vue.
- <template>
- <div id="heatmap">
- <ejs-heatmap id="heatmap" :dataSource='dataSource' :xAxis='xAxis' :yAxis='yAxis' :titleSettings='titleSettings' :legendSettings='legendSettings'></ejs-heatmap>
- </div>
- </template>
- <script>
- import Vue from 'vue';
- import { HeatMapPlugin, Tooltip, Legend } from '@syncfusion/ej2-vue-heatmap';
- Vue.use(HeatMapPlugin);
- export default {
- data (){
- return{
- xAxis: {
- labels: ['Nancy', 'Andrew','Janet', 'Margaret', 'Steven', 'Michael', 'Robert', 'Laura', 'Anne', 'Paul', 'Karin', 'Mario'],
- },
- yAxis:{
- labels: ['Mon', 'Tues', 'Wed', 'Thurs', 'Fri', 'Sat'],
- },
- titleSettings: {
- text: 'Sales Revenue per Employee (in 1000 US$)',
- },
- dataSource: [
- [73, 39, 26, 39, 94, 0],
- [93, 58, 53, 38, 26, 68],
- [99, 28, 22, 4, 66, 90],
- [14, 26, 97, 69, 69, 3],
- [7, 46, 47, 47, 88, 6],
- [41, 55, 73, 23, 3, 79],
- [56, 69, 21, 86, 3, 33],
- [45, 7, 53, 81, 95, 79],
- [60, 77, 74, 68, 88, 51],
- [25, 25, 10, 12, 78, 14],
- [25, 56, 55, 58, 12, 82],
- [74, 33, 88, 23, 86, 59]
- ],
- legendSettings: {
- visible:true,
- }
- }
- },
- provide:{
- heatmap:[Tooltip, Legend]
- },
- }
- </script>
Though the Vue HeatMap Chart can render data points using both SVG and canvas modes, it uses canvas rendering mode while displaying large volumes of data for the best initial load performance and optimized memory usage.
The HeatMap Chart can be bound to data using JSON or an array of objects. JSON data can be local or remote, and it can be retrieved using different adaptors. The JSON data can be nested as well.

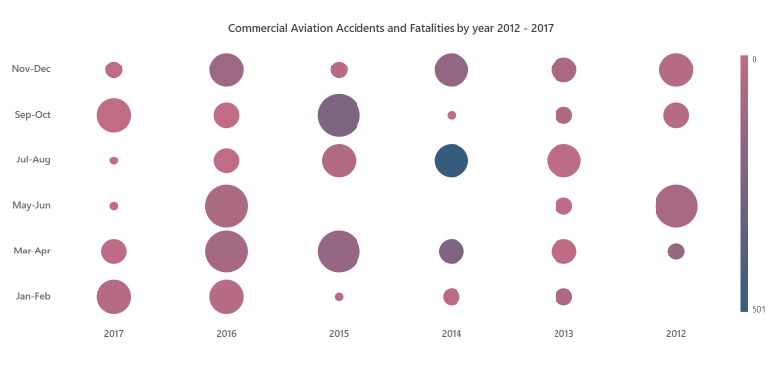
The Vue bubble HeatMap Chart or the matrix bubble chart, visualizes data using variations in bubble attributes such as size, color, and sector.
The Vue calendar HeatMap visualizes time series data, with each data point representing a value bound to a specific time.
Populate data in the Vue HeatMap Chart using different axis types: numeric, category, and date-time.
Use a numeric axis to represent numeric data in a HeatMap.
Use a date-time axis to represent time series data in a HeatMap. Similarly, display dates and times as axis labels with different formats.
Use a category axis to represent non-numerical data in a HeatMap and display text labels instead of numbers.
The Vue HeatMap Chart allows you to customize axis elements to make an axis more readable.
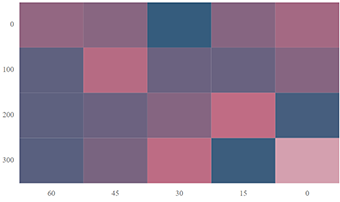
Achieve RTL layout by reversing the axis labels. This swaps the higher and lower ranges of an axis.
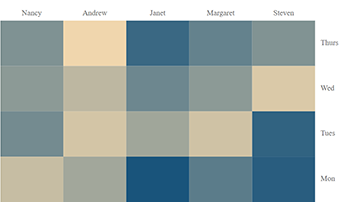
Arrange the axes smartly by moving them to positions opposite to their default positions.
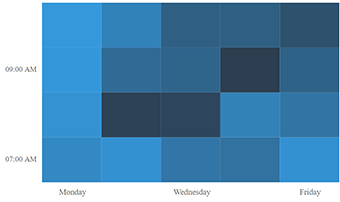
Set axis labels with regular intervals, hiding adjacent labels across all types of axes.
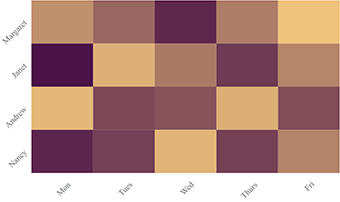
Rotate axis labels clockwise or counterclockwise to any desired angle.
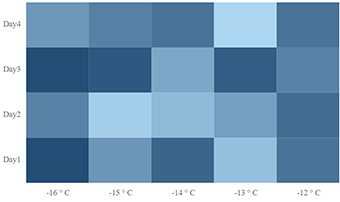
Customize the axis label text using the available formatting options.
Customize the default appearance of a cell or data point using the available formatting options.
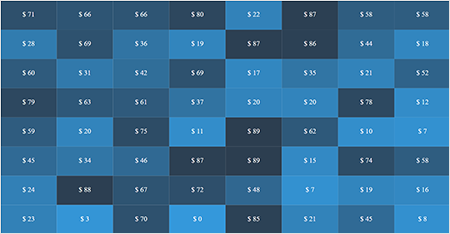
Toggle visibility or format the data labels to display custom text along with the cell values.
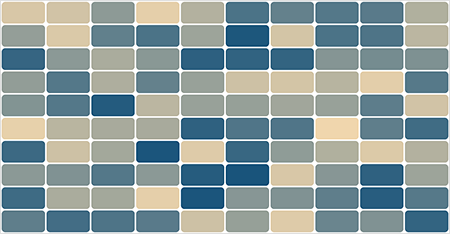
Change the borders and cell spacing by customizing the border settings.
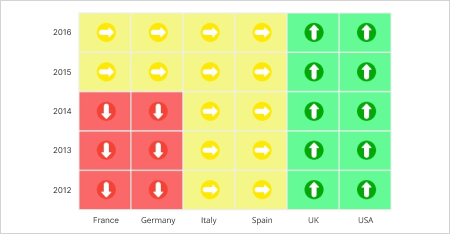
Render any HTML element as a label for the cells in the HeatMap.
Customize the default color settings of the HeatMap cells with gradient or solid custom colors.
Color ranges allow a color to be applied to specific ranges in HeatMap cells.
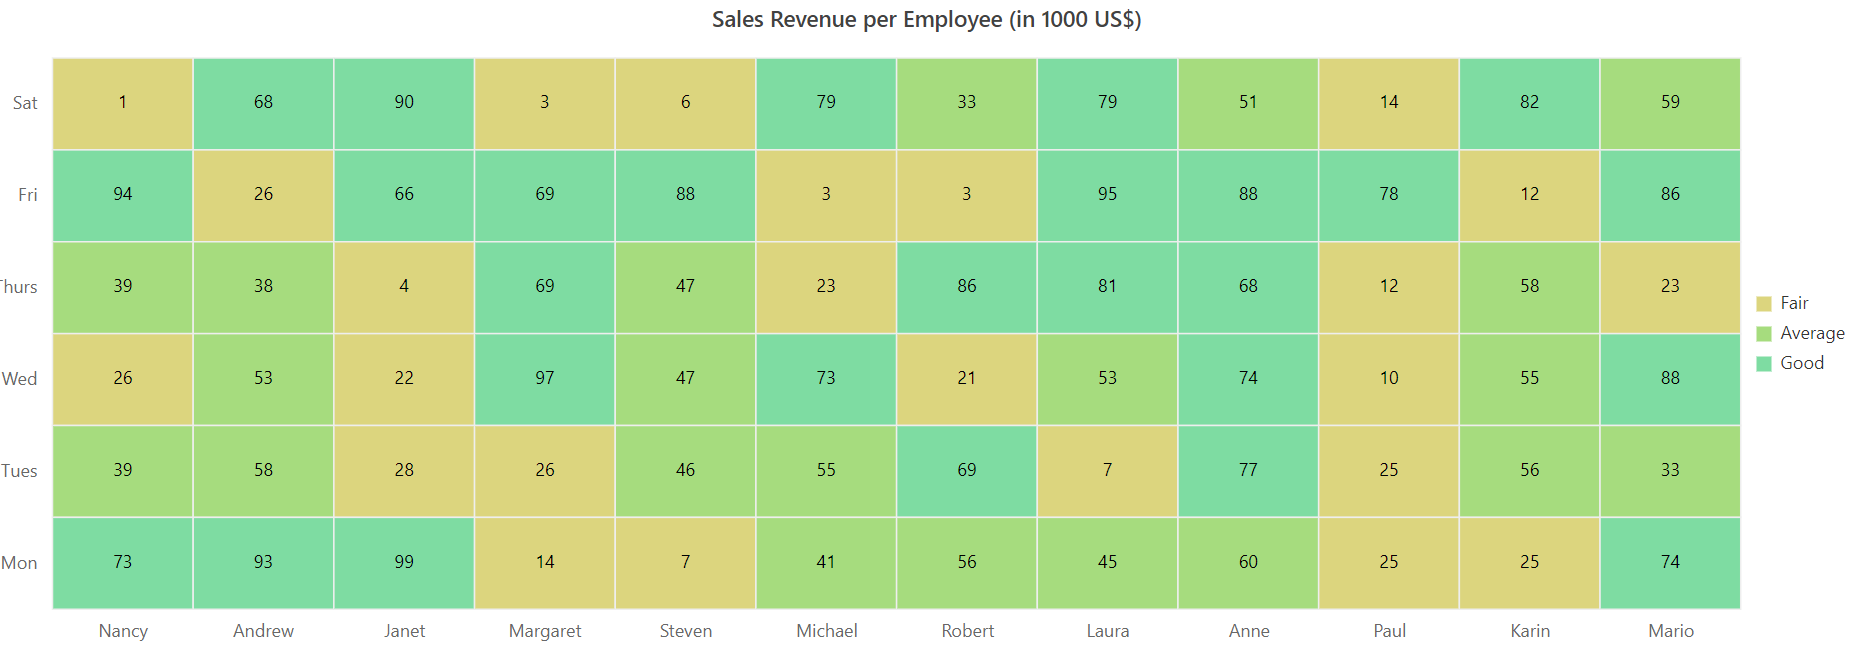
Display additional information about data points in the Vue HeatMap Chart using a legend.

Choose between a gradient pointer and a list-type legend for improving data points readability.
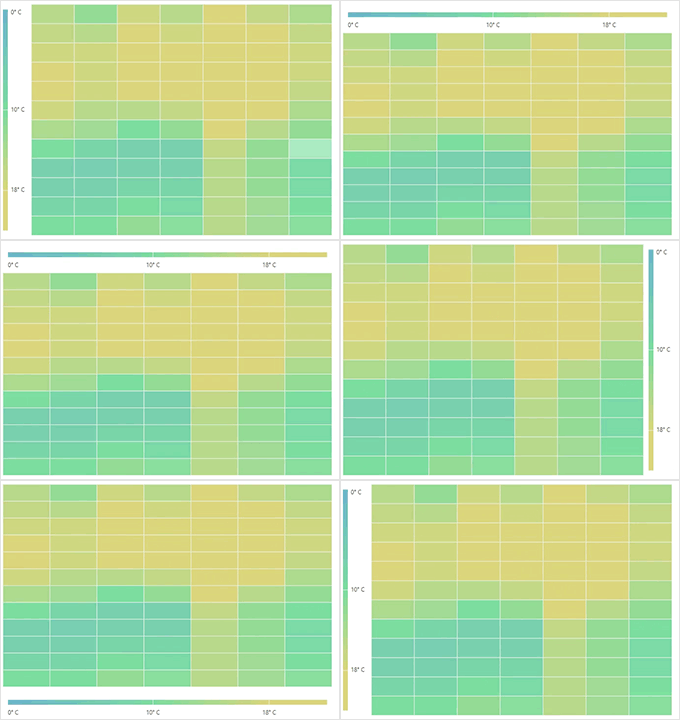
Place the legend anywhere in the chart area to make it fit best on a page.
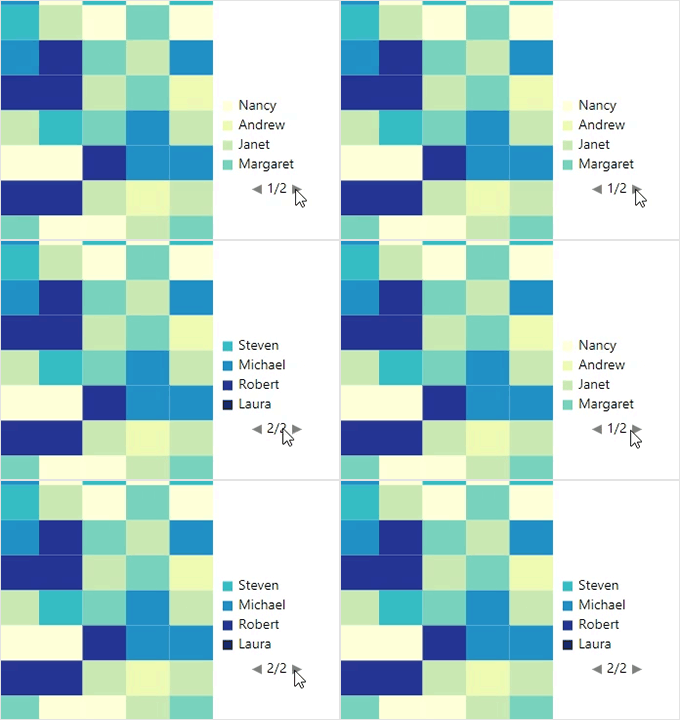
The control enables paging when legend items exceed the bounds. Then, each legend item can be viewed by navigating between the pages.
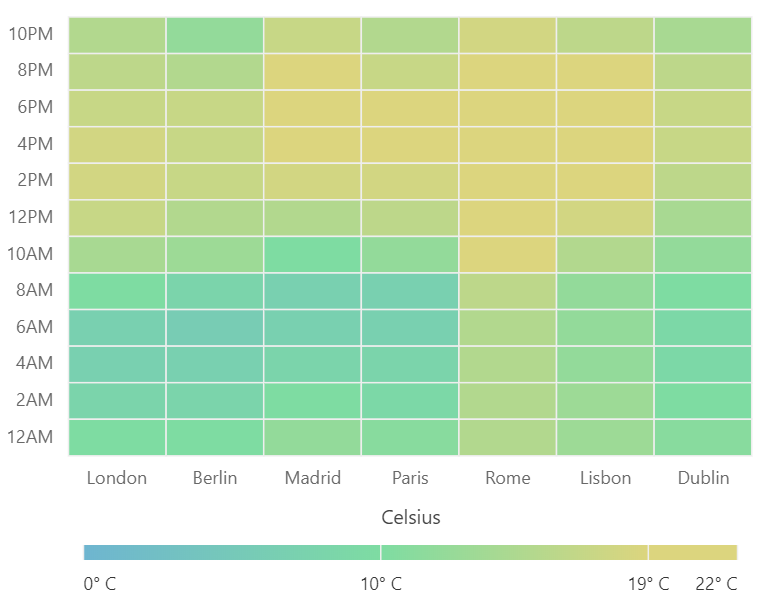
A legend title provides information about the heatmap legend.
Handle missed or undefined data values with empty data points.
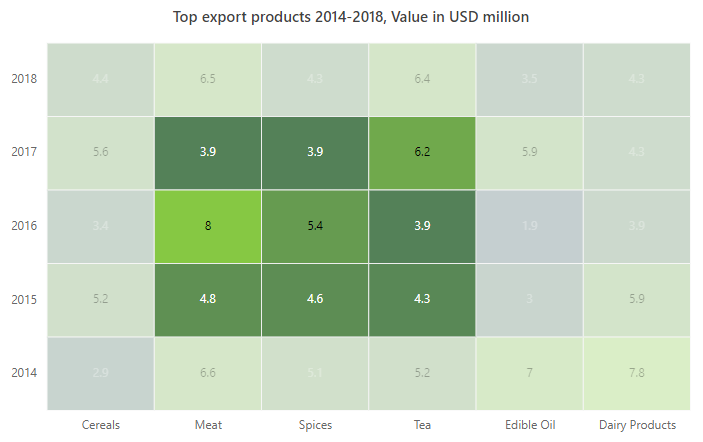
Select single or multiple cells using keyboard, mouse, and touch interactions.
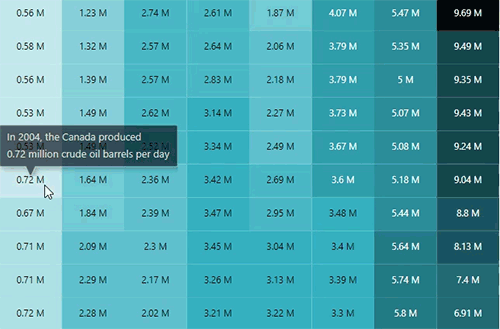
Display additional information for the data points with tooltips on mouse hover.
The HeatMap Chart is available for the Blazor, React, Angular, and JavaScript frameworks. Explore its platform-specific options through the following links:
The Vue HeatMap Chart works well with all modern web browsers, including Chrome, Firefox, Edge, Safari, and Opera.

The Syncfusion HeatMap Chart for Vue provides the following features:
We do not sell the Vue HeatMap Chart separately. It is only available for purchase as part of the Syncfusion team license. This contains over 1,900 components and frameworks, including the Vue HeatMap Chart. The price of the team license starts at $395 per month for 5 developers, and includes support and updates until the subscription expires. In addition, we might offer discounts based on currently active promotions. Please contact our product specialists today to see if you qualify for any additional discounts.
You can find our Vue HeatMap Chart demo, which demonstrates how to render and configure the HeatMap Chart.
No, our 1,900+ components and frameworks for web, mobile, and desktop, including our Vue HeatMap Chart, are not sold individually. They are only available as part of a team license. However, we have competitively priced the product, so it only costs a little bit more than what some other vendors charge for their HeatMap Chart component alone. We have also found that, in our experience, our customers usually start off using one of our products and then expand to several products quickly, so we felt it was best to offer all 1,900+ components and frameworks for a subscription fee that starts at $395 per month for a team of 5 developers. Additionally, we might be able to offer discounts based on currently active promotions. Please contact our product specialists today to see if you qualify for any additional discounts.
No, this is a commercial product and requires a paid license. However, a free Community License is also available for companies and individuals whose organizations have less than $1 million USD in annual gross revenue, 5 or fewer developers, and 10 or fewer total employees.
A good place to start would be our comprehensive getting started documentation.
 Figma Download
Greatness—it’s one thing to say you have it, but it means more when others recognize it. Syncfusion® is proud to hold the following industry awards.