Overview
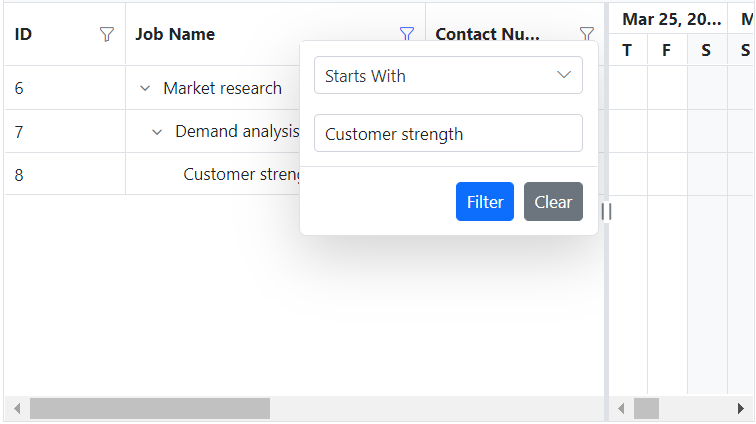
The React Gantt Chart filtering helps view specific or related records, which meet a given filtering criteria. It supports various filter types that include powerful Excel-like filter. Allows users to choose appropriate filter type, define their own custom filtering logic, and customize the filtering UI based on their application needs. Filtering with related parent or child records can be defined.
Filter hierarchy modes
Allows users to view parent or child records or both relative records along with the filtered records in a Gantt chart. Helps users to be aware of record’s hierarchy even when filtering.


Powerful Excel-like filter
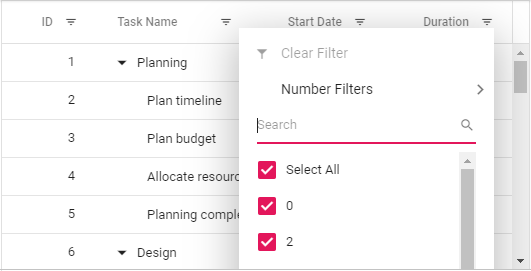
The Excel-like filter helps create filter criteria for a column by allowing users to select possible filter values from a checkbox list. Additionally, users can build complex filter criteria using the advanced filter option.
Custom filter/extensible filter UI
Filter UI and logic for a column will be applied based on the column type. Users can also define their own custom filter UI and filtering logic for a column to suit their application needs.


Search
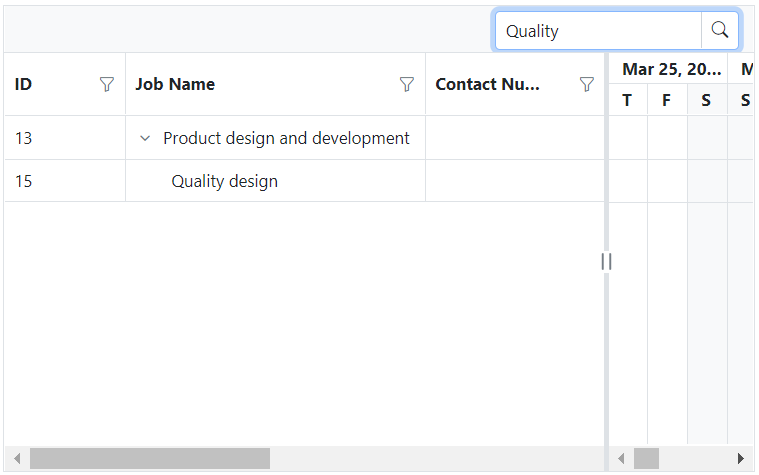
Search Gantt Chart rows using built-in search box in the toolbar or programmatically. Using built-in settings, search behavior can be customized.
Our Customers Love Us


Discover Syncfusion’s Complete React Component Ecosystem
Explore over 145+ React UI components featuring established, production-ready controls and the latest pure React components built natively for modern web app development.
-
React Components
-
Pure React Components
-
SMART COMPONENTSGRIDSDATA VISUALIZATIONDROPDOWNSFILE VIEWERS & EDITORSBUTTONSINTERACTIVE CHATINPUTSNAVIGATIONFORMSNOTIFICATIONS
-
GRIDSDATA VISUALIZATIONNAVIGATIONINPUTS


