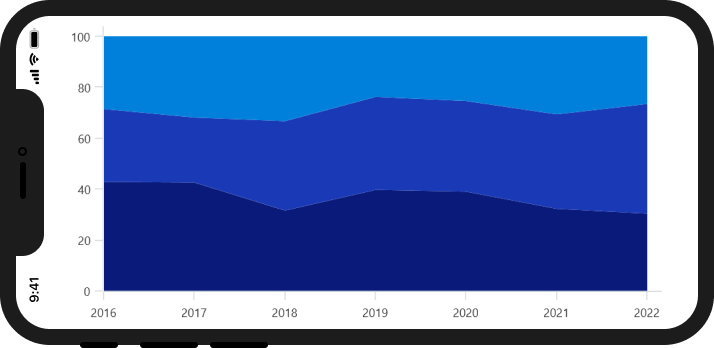
The .NET MAUI 100% stacked area chart displays multiple series of data as stacked areas, ensuring that the cumulative proportions of the stacked elements always totals 100%. The y-axis will always render within the range 0–100. You can create beautiful, animated, real-time, high-performance stacked area charts that also support interactive features such as zooming and panning, trackball, and tooltip.
.NET MAUI 100% Stacked Area Chart documentation

Data labels display information about data points. Customize the labels’ foreground, border, and background. Rotate a data label by a specified angle.
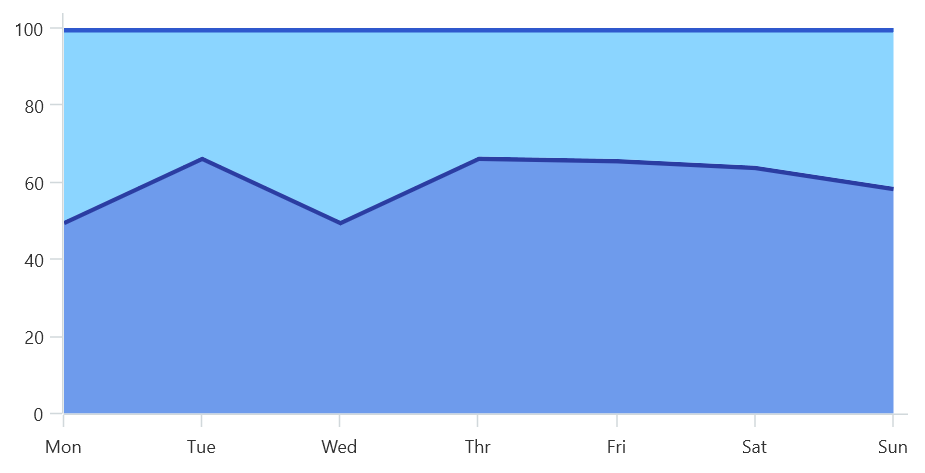
The .NET MAUI 100% stacked area chart offers UI customization using built-in APIs for adjusting colors and borders, enhancing its visual appeal with a distinctive look.

Empty or null data points are elegantly handled in the .NET MAUI 100% stacked area chart.
- <ContentPage xmlns="http://schemas.microsoft.com/dotnet/2021/maui"
- xmlns:x="http://schemas.microsoft.com/winfx/2009/xaml"
- x:Class="ChartExample.MainPage"
- xmlns:local="using:ChartExample"
- xmlns:chart="clr-namespace:Syncfusion.Maui.Charts;assembly=Syncfusion.Maui.Charts">
-
- <Grid>
- <chart:SfCartesianChart HorizontalOptions="FillAndExpand" VerticalOptions="FillAndExpand">
- <!--Setting BindingContext-->
- <chart:SfCartesianChart.BindingContext>
- <local:ViewModel/>
- </chart:SfCartesianChart.BindingContext>
-
- <!--Initialize the horizontal axis for the .NET MAUI Cartesian Chart.-->
- <chart:SfCartesianChart.XAxes>
- <chart:CategoryAxis/>
- </chart:SfCartesianChart.XAxes>
-
- <!--Initialize the vertical axis for the .NET MAUI Cartesian Chart.-->
- <chart:SfCartesianChart.YAxes>
- <chart:NumericalAxis/>
- </chart:SfCartesianChart.YAxes>
-
- <!--Adding Stacked Area 100 Series to the .NET MAUI Cartesian Chart.-->
- <chart:SfCartesianChart.Series>
- <chart:StackingArea100Series
- ItemsSource="{Binding Data}"
- XBindingPath="Month"
- YBindingPath="Target">
- </chart:StackingArea100Series>
- <chart:StackingArea100Series
- ItemsSource="{Binding Data}"
- XBindingPath="Month"
- YBindingPath="High">
- </chart:StackingArea100Series>
- <chart:StackingArea100Series
- ItemsSource="{Binding Data}"
- XBindingPath="Month"
- YBindingPath="Low">
- </chart:StackingArea100Series>
- </chart:SfCartesianChart.Series>
- </chart:SfCartesianChart>
- </Grid>
- </ContentPage>
- public class Model
- {
- public string Month { get; set; }
- public double Target { get; set; }
- public double High { get; set; }
- public double Low { get; set; }
-
- public Model(string xValue, double yValue, double high, double low)
- {
- Month = xValue;
- Target = yValue;
- High = high;
- Low = low;
- }
- }
-
- public class ViewModel
- {
- public ObservableCollection<Model> Data { get; set; }
- public ViewModel()
- {
- Data = new ObservableCollection<Model>()
- {
- new Model("2010", 100,90,60),
- new Model("2011", 120,100,80),
- new Model("2012", 140,120,90),
- new Model("2013", 160,140,100),
- };
- }
- }

.NET MAUI 100% Stacked Area Chart User Guide
See available options to customize the .NET MAUI 100% stacked area chart.

.NET MAUI 100% Stacked Area Chart API References
Explore the .NET MAUI 100% stacked area chart APIs.
