The .NET MAUI spline area chart is designed for visualizing quantitative data. It is an area chart type that plots a fitted curve through each data point in a series. It is used to represent time-dependent data and show trends in data at equal intervals.
.NET MAUI Spline Area Chart documentation

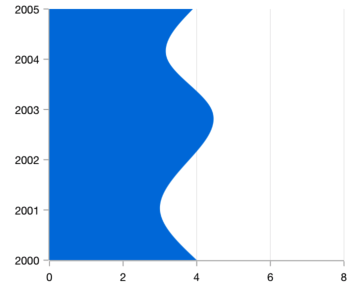
Rotate the spline area chart to plot data vertically and view it from a different perspective.
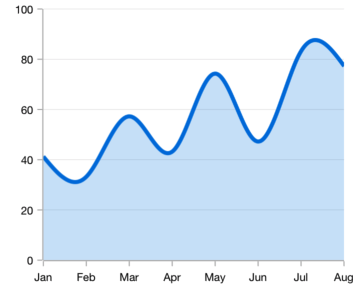
Customize the color and thickness of the spline area chart using built-in APIs to make it visually unique.
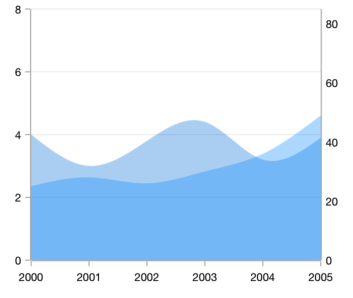
Use multiple axes to plot different data sets that widely vary from one another.
- <ContentPage xmlns="http://schemas.microsoft.com/dotnet/2021/maui"
- xmlns:x="http://schemas.microsoft.com/winfx/2009/xaml"
- x:Class="ChartExample.MainPage"
- xmlns:local="using:ChartExample"
- xmlns:chart="clr-namespace:Syncfusion.Maui.Charts;assembly=Syncfusion.Maui.Charts">
-
- <Grid>
- <chart:SfCartesianChart HorizontalOptions="FillAndExpand" VerticalOptions="FillAndExpand">
- <!--Setting BindingContext-->
- <chart:SfCartesianChart.BindingContext>
- <local:ViewModel/>
- </chart:SfCartesianChart.BindingContext>
-
- <!--Initialize the horizontal axis for the .NET MAUI Cartesian Chart.-->
- <chart:SfCartesianChart.XAxes>
- <chart:CategoryAxis/>
- </chart:SfCartesianChart.XAxes>
-
- <!--Initialize the vertical axis for the .NET MAUI Cartesian Chart.-->
- <chart:SfCartesianChart.YAxes>
- <chart:NumericalAxis/>
- </chart:SfCartesianChart.YAxes>
-
- <!--Adding Spline Area Series to the .NET MAUI Cartesian Chart.-->
- <chart:SplineAreaSeries
- ItemsSource="{Binding Data}"
- XBindingPath="Month"
- YBindingPath="Target">
- </chart:SplineAreaSeries>
- </chart:SfCartesianChart>
- </Grid>
- </ContentPage>
- public class Model
- {
- public string Month { get; set; }
-
- public double Target { get; set; }
-
- public Model(string xValue, double yValue)
- {
- Month = xValue;
- Target = yValue;
- }
- }
-
- public class ViewModel
- {
- public ObservableCollection<Model> Data { get; set; }
-
- public ViewModel()
- {
- Data = new ObservableCollection<Model>()
- {
- new Model("Jan", 50),
- new Model("Feb", 70),
- new Model("Mar", 65),
- new Model("Apr", 57),
- new Model("May", 48),
- };
- }
- }

.NET MAUI Spline Area Chart User Guide
Learn more about the available options to customize .NET MAUI spline area charts.

