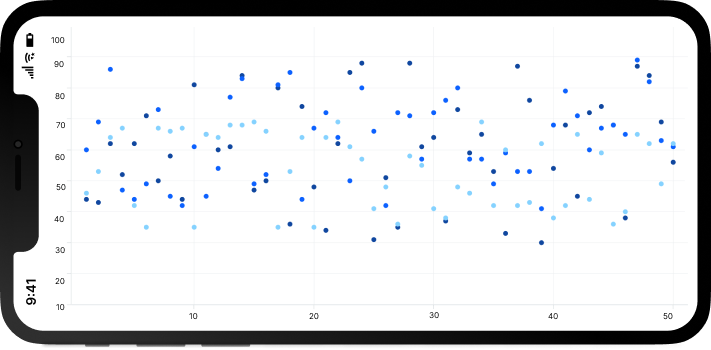
The .NET MAUI scatter chart plots data with two numeric parameters. Plot multiple scatter series in a single chart to compare different data sets. The scatter chart uses Cartesian coordinates to display values for two variables, typically, for a set of data.
.NET MAUI Scatter Chart documentation
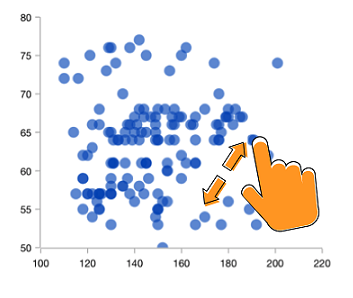
Zoom and pan to visualize data points in any region when dealing with large amounts of data.
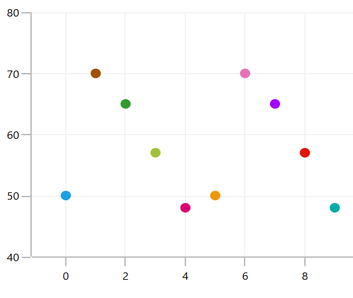
The look and feel of a scatter chart can be customized using built-in APIs.
- <ContentPage xmlns="http://schemas.microsoft.com/dotnet/2021/maui"
- xmlns:x="http://schemas.microsoft.com/winfx/2009/xaml"
- x:Class="ChartExample.MainPage"
- xmlns:local="using:ChartExample"
- xmlns:chart="clr-namespace:Syncfusion.Maui.Charts;assembly=Syncfusion.Maui.Charts">
-
- <Grid>
- <chart:SfCartesianChart HorizontalOptions="FillAndExpand" VerticalOptions="FillAndExpand">
- <!--Setting BindingContext-->
- <chart:SfCartesianChart.BindingContext>
- <local:ViewModel/>
- </chart:SfCartesianChart.BindingContext>
-
- <!--Initialize the horizontal axis for the .NET MAUI Cartesian Chart.-->
- <chart:SfCartesianChart.XAxes>
- <chart:CategoryAxis/>
- </chart:SfCartesianChart.XAxes>
-
- <!--Initialize the vertical axis for the .NET MAUI Cartesian Chart.-->
- <chart:SfCartesianChart.YAxes>
- <chart:NumericalAxis/>
- </chart:SfCartesianChart.YAxes>
-
- <!--Adding Scatter Series to the .NET MAUI Cartesian Chart.-->
- <chart:ScatterSeries
- PointHeight="9"
- PointWidth="9"
- ItemsSource="{Binding Data}"
- XBindingPath="Month"
- YBindingPath="Target">
- </chart:ScatterSeries>
- </chart:SfCartesianChart>
- </Grid>
- </ContentPage>
- public class Model
- {
- public string Month { get; set; }
-
- public double Target { get; set; }
-
- public Model(string xValue, double yValue)
- {
- Month = xValue;
- Target = yValue;
- }
- }
-
- public class ViewModel
- {
- public ObservableCollection<Model> Data { get; set; }
-
- public ViewModel()
- {
- Data = new ObservableCollection<Model>()
- {
- new Model("Jan", 50),
- new Model("Feb", 70),
- new Model("Mar", 65),
- new Model("Apr", 57),
- new Model("May", 48),
- };
- }
- }

.NET MAUI Scatter Chart User Guide
Learn more about the available options to customize .NET MAUI scatter charts.

