The .NET MAUI line chart represents and visualizes time-dependent data to show trends at equal intervals. It supports numeric, category, and date-time axes, and works well with large amounts of data with animation, zooming, and panning.
.NET MAUI line chart documentation

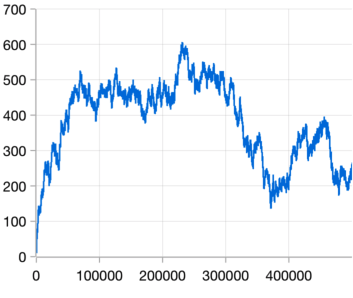
The fast line chart is a special kind of line chart that can smoothly render a data collection with a large number of data points.
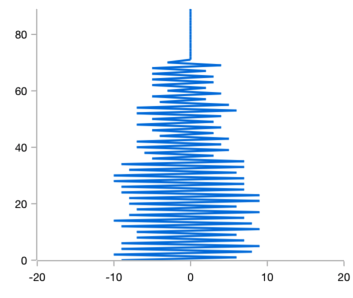
The line chart can be transposed vertically to view data from a different perspective.
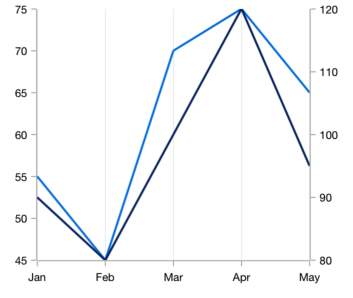
Use multiple axes to plot different data sets along two or more axes having different data points and values.
Easily get started with line chart using a few simple lines of XAML and C# code, as demonstrated below.
- <ContentPage xmlns="http://schemas.microsoft.com/dotnet/2021/maui"
- xmlns:x="http://schemas.microsoft.com/winfx/2009/xaml"
- x:Class="ChartExample.MainPage"
- xmlns:local="using:ChartExample"
- xmlns:chart="clr-namespace:Syncfusion.Maui.Charts;assembly=Syncfusion.Maui.Charts">
-
- <Grid>
- <chart:SfCartesianChart HorizontalOptions="FillAndExpand" VerticalOptions="FillAndExpand">
- <!--Setting BindingContext-->
- <chart:SfCartesianChart.BindingContext>
- <local:ViewModel/>
- </chart:SfCartesianChart.BindingContext>
-
- <!--Initialize the horizontal axis for the .NET MAUI Cartesian Chart-->
- <chart:SfCartesianChart.XAxes>
- <chart:CategoryAxis/>
- </chart:SfCartesianChart.XAxes>
-
- <!--Initialize the vertical axis for the .NET MAUI Cartesian Chart-->
- <chart:SfCartesianChart.YAxes>
- <chart:NumericalAxis/>
- </chart:SfCartesianChart.YAxes>
-
- <!--Adding LineSeries to the .NET MAUI Cartesian Chart-->
- <chart:LineSeries
- ItemsSource="{Binding Data}"
- XBindingPath="Month"
- YBindingPath="Target">
- </chart:LineSeries>
- </chart:SfCartesianChart>
- </Grid>
- </ContentPage>
- public class Model
- {
- public string Month { get; set; }
-
- public double Target { get; set; }
-
- public Model(string xValue, double yValue)
- {
- Month = xValue;
- Target = yValue;
- }
- }
-
- public class ViewModel
- {
- public ObservableCollection<Model> Data { get; set; }
-
- public ViewModel()
- {
- Data = new ObservableCollection<Model>()
- {
- new Model("Jan", 50),
- new Model("Feb", 70),
- new Model("Mar", 65),
- new Model("Apr", 57),
- new Model("May", 48),
- };
- }
- }

Explore the .NET MAUI line chart example from GitHub to learn how to render and configure charts.

