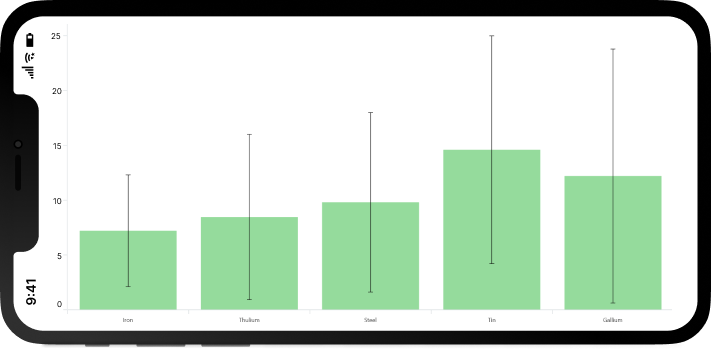
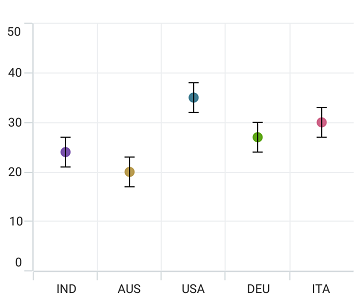
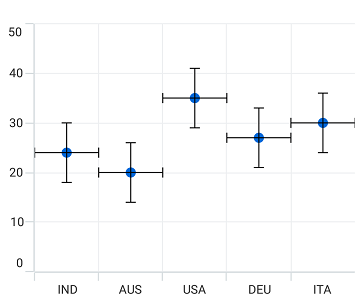
The .NET MAUI error bar chart displays tables of means or medians and variabilities. Error bars indicate errors or uncertainties in the reported values, showing possible variations in measurements displayed as data points. This chart also supports zooming, scrolling, tooltips, and trackball.


The .NET MAUI error bar chart allows you to customize the color, thickness, and cap length with built-in APIs, making it visually unique.

The .NET MAUI error bar chart supports different types of drawing modes, such as horizontal, vertical, and both.

The .NET MAUI error bar chart renders in positive, negative, and both directions.
- <ContentPage xmlns="http://schemas.microsoft.com/dotnet/2021/maui"
- xmlns:x="http://schemas.microsoft.com/winfx/2009/xaml"
- x:Class="ChartExample.MainPage"
- xmlns:local="using:ChartExample"
- xmlns:chart="clr-namespace:Syncfusion.Maui.Charts;assembly=Syncfusion.Maui.Charts">
-
- <Grid>
- <chart:SfCartesianChart HorizontalOptions="FillAndExpand" VerticalOptions="FillAndExpand">
- <!--Setting BindingContext-->
- <chart:SfCartesianChart.BindingContext>
- <local:ViewModel/>
- </chart:SfCartesianChart.BindingContext>
-
- <!--Initialize the horizontal axis for the .NET MAUI Cartesian Chart.-->
- <chart:SfCartesianChart.XAxes>
- <chart:CategoryAxis/>
- </chart:SfCartesianChart.XAxes>
-
- <!--Initialize the vertical axis for the .NET MAUI Cartesian Chart.-->
- <chart:SfCartesianChart.YAxes>
- <chart:NumericalAxis/>
- </chart:SfCartesianChart.YAxes>
-
- <!--Adding Error Bar Series to the .NET MAUI Cartesian Chart.-->
- <chart:ErrorBarSeries
- ItemsSource="{Binding Data}" Type="Custom"
- XBindingPath="Month" HorizontalErrorPath="Low"
- YBindingPath="Target" VerticalErrorPath="High">
- </chart:ErrorBarSeries>
- </chart:SfCartesianChart>
- </Grid>
- </ContentPage>
- public class Model
- {
- public string Month { get; set; }
-
- public double Target { get; set; }
-
- public double High { get; set; }
-
- public double Low { get; set; }
-
- public Model(string xValue, double yValue, double high, double low)
- {
- Month = xValue;
- Target = yValue;
- High = high;
- Low = low;
- }
- }
-
- public class ViewModel
- {
- public ObservableCollection<Model> Data { get; set; }
-
- public ViewModel()
- {
- Data = new ObservableCollection<Model>()
- {
- new Model("Jan", 50, 5, 0.5),
- new Model("Feb", 70, 5, 0.5),
- new Model("Mar", 65, 5, 0.5),
- new Model("Apr", 57, 5, 0.5),
- new Model("May", 48, 5, 0.5),
- };
- }
- }

.NET MAUI Error Bar Chart User Guide
Learn about the options available to customize the .NET MAUI error bar chart.
