Overview
Axes in the Polar Charts control identify the values of the visualized data. Polar charts typically have two axes that are used to measure and categorize data: secondary and primary.
The secondary axis always uses a numerical scale. The primary axis supports all scale types.
Types

Categorical
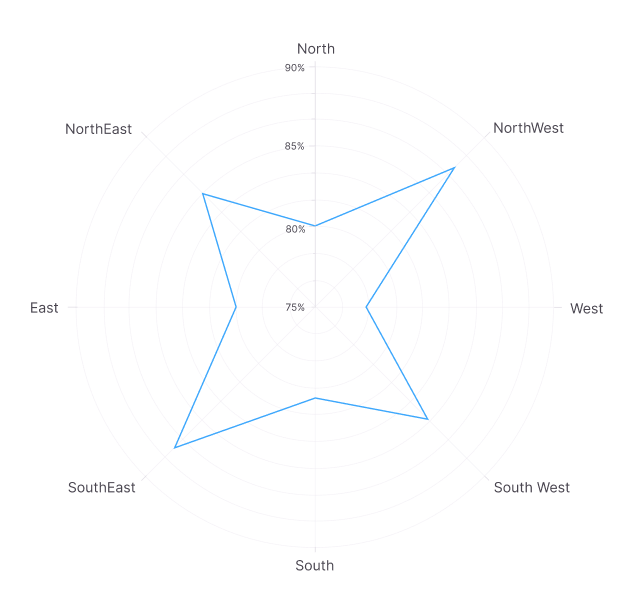
The categorical axis is a nonlinear axis that displays text in axis labels.

Numeric
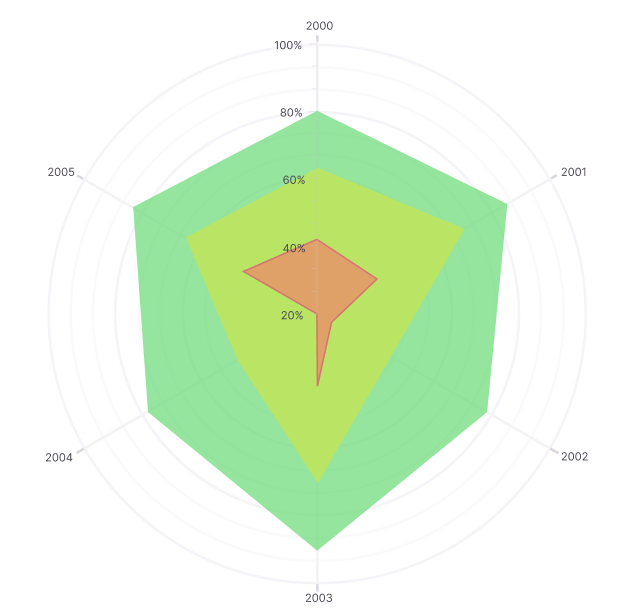
The numeric axis is a linear axis that displays numbers in equal intervals in the labels.

Date-time
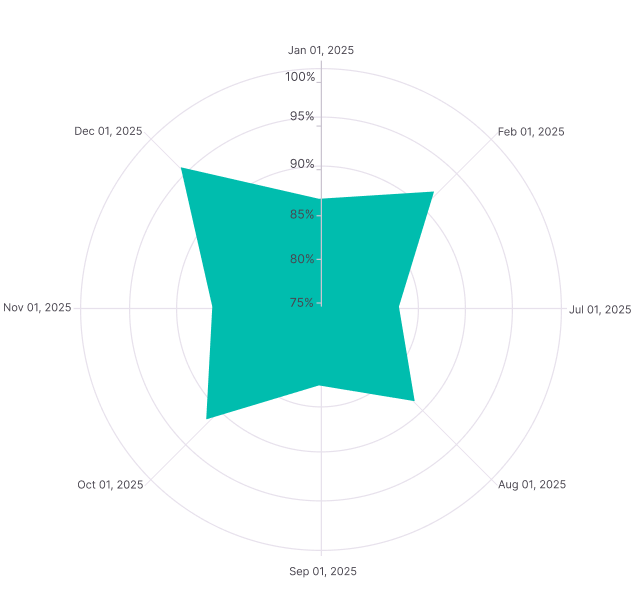
The date-time axis displays date-time values with an equal interval in the axis labels. It is typically used as a primary axis.

Date-time category
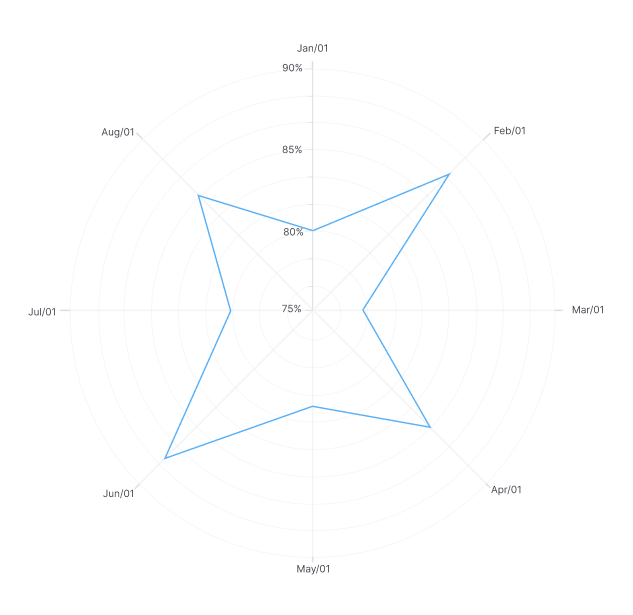
The date-time category axis displays the date-time values with non-linear intervals. It is typically used as an x-axis.
Customizations

Inverted axis
Reverse the values on the axis of .NET MAUI Polar Charts.

Axis labels
Charts provide many customization options for axis labels, including positioning, placement, formatting, and rotation. It also has options to avoid labels overlapping.

Gridlines
Customization of gridlines can be achieved through stroke, strokedasharray, and strokewidth.
Our Customers Love Us


