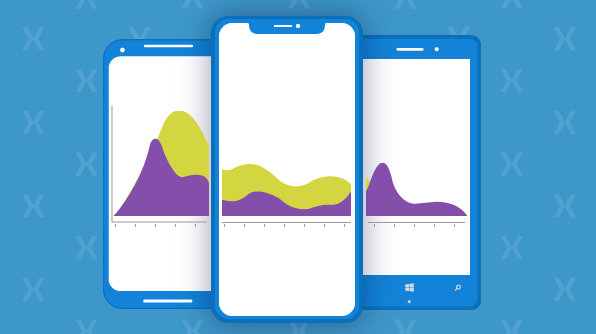
We are excited to announce updates for our very popular Xamarin chart control in the 2018 Volume 2 release. The focus of this release for the chart component is to support macOS on Xamarin platforms, and other usability related features and improvements based on customer feedback. Here are all the planned updates:
- Chart support for macOS in Xamarin.Forms (preview).
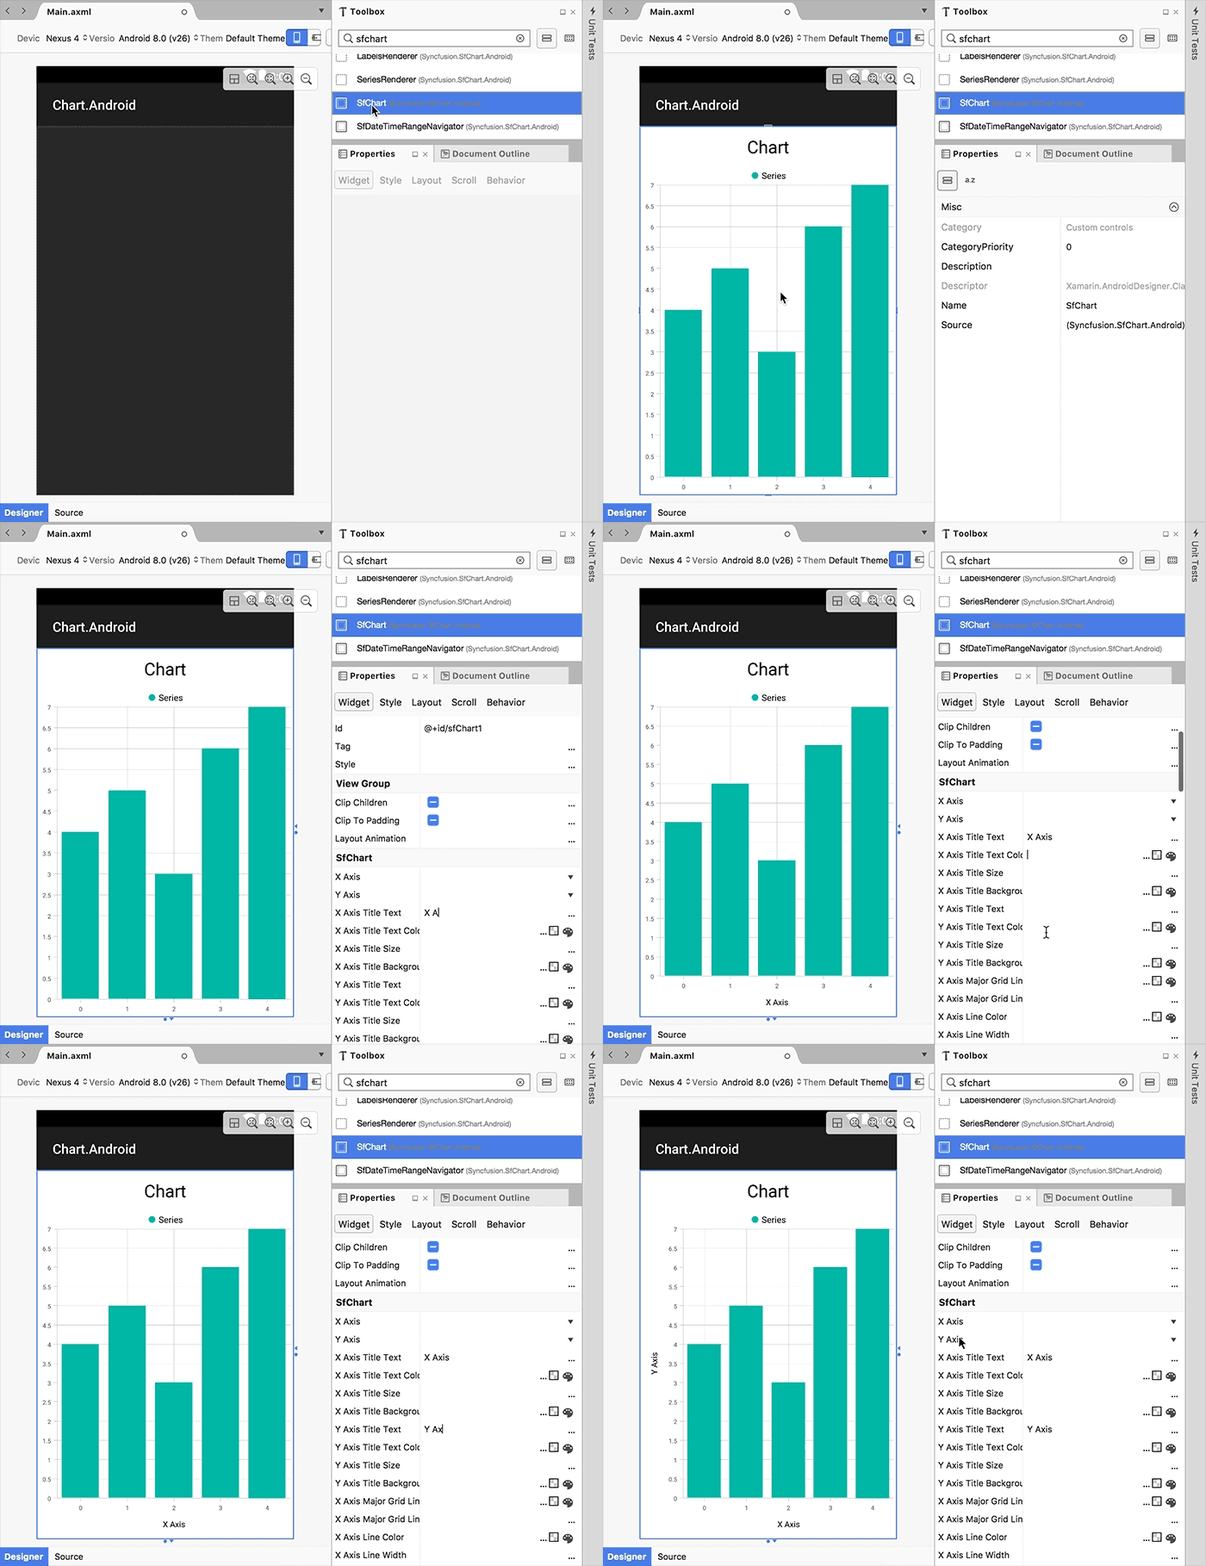
- Attribute support for designing in AXML files in Xamarin.Android.
- Date-time category axis support.
- “Others” category in pie and doughnut series for grouping small data points.
- Ability to add text to the center of doughnut charts.
- Different shape types in scatter series.
Let’s take a deeper look at each of these features.
Chart supports macOS in Xamarin.Forms (preview)
It’s been more than three years since the release of Xamarin.Forms, and it’s been aggressively improved by adding support for more platforms, implementing dozens of new features, and providing greater stability. We at Syncfusion closely monitor changes in Xamarin.Forms and continue to ensure our controls always work with the latest version. Now, we will begin adding support for the macOS platform in our Xamarin.Forms controls, starting with the chart, data grid, and list view. The Xamarin.Forms for macOS versions of our controls will support the same features that are available in the other Xamarin.Forms platforms. To include the macOS platform as a target in your existing Xamarin.Forms project, create a new Xamarin.Mac project and add the Xamarin.Forms libraries as explained in
this blog. Next, add the Syncfusion.Xamarin.SfChart NuGet package or the necessary assemblies inside the macOS folder to include the chart component. That’s it! Now your app is ready to be installed in a Mac machine with a beautiful chart control.
Attribute support for designing in AXML files in Xamarin.Android
What else would help reduce layout design time in Xamarin.Android apps? How about being able to see a preview of an entire layout in the designer, with proper rendering of all the views and the actual output. In 2018 Volume 2, the chart control for Xamarin.Android will be rendered in the designer when you drag and drop from the toolbox, and also support attributes for customizing the appearance. With these improvements, it is no longer a requirement to deploy the app in a device or emulator to check the output of your layout for every change.
Xamarin.Android project with layout preview
Date-time category axis support
A date-time category axis is one of the most requested features from our customers. It allows users to plot date-time values without a visual gap between two data points. It is similar to a category axis, but the ranges and interval are calculated based on the date-time value. The following code example shows how to create the DateTimeCategoryAxis and set it to the PrimaryAxis property.
 <chart:SfChart.PrimaryAxis>

            <chart:DateTimeCategoryAxis/>

  </chart:SfChart.PrimaryAxis>

Chart with date-time category axis
Group small data points into “others” category in pie and doughnut series
When there are so many data points in a pie or doughnut chart that it is difficult to see the smallest slices, one solution is to group the smallest values into an “Others” category. Support for this behavior has been added to the Xamarin chart component in 2018 Volume 2. It can be configured using two properties: GroupMode, which specifies the grouping type to be based on slice angle, actual data point value, or percentage; and GroupTo, which sets the limit to group data points into a single slice. The following code example shows how to group the segments in a pie series.
<chart:PieSeries GroupMode="Value" GroupTo="25" ExplodeOnTouch="True" EnableTooltip="True" ItemsSource="{Binding PieData}" XBindingPath="Name" YBindingPath="Value"/>

Pie chart with “Others” category
Add text to the center of a doughnut chart
Text or any view can be added at the center of a doughnut chart to show any information about the data presented. It is typically used to show information about a selected doughnut slice or any other information about the visualized data. The binding context of the center view will be the chart series so that you can make use of data binding to display any information from the chart series. The following code example shows how to set up the center view of a doughnut chart and how to bind some properties from ViewModel.
<chart:DoughnutSeries ItemsSource="{Binding DoughnutSeriesData}" XBindingPath="Name" YBindingPath="Value"  ExplodeOnTouch="true" EnableDataPointSelection="true">

                    <chart:DoughnutSeries.CenterView>
                        <StackLayout Orientation ="Vertical">
                            <Label Text="{Binding BindingContext.SelectedItemName}"/>
                            <Label Text="{Binding BindingContext.SelectedItemPercentage}" FontSize="12"/>
                        </StackLayout>
                    </chart:DoughnutSeries.CenterView>

 </chart:DoughnutSeries>

Doughnut chart with text in center
Different shapes in scatter series
Previously, we have relied on data marker symbols and assigning series a transparent color to plot scatter charts with different shapes. Now we have added support for shapes, and you can directly configure them in scatter series by using the ShapeType property. The available shapes are cross, diamond, ellipse, hexagon, inverted triangle, pentagon, plus, rectangle, and triangle. The following code example shows how to set up a scatter chart with default and diamond shapes.
            <chart:SfChart.Series>
                <chart:ScatterSeries ItemsSource="{Binding Male}" Label="Male" XBindingPath="Height" YBindingPath="Value"/>
                <chart:ScatterSeries ScatterType="Diamond" ItemsSource="{Binding Female}" Label="Female" XBindingPath="Height" YBindingPath="Value"/>
            </chart:SfChart.Series>

Scatter chart with different shapes
This is not a complete list of all the Xamarin chart features added in 2018 Volume 2. We have a few more minor improvements in the works, such as adding separate views for each annotation and series, exposing events and methods to get touch actions on annotations, adding events for data marker creation, and trackball movement actions, along with bug fixes. Download our 2018 Volume 2 release of Essential Studio® for Xamarin from the following link:
https://www.syncfusion.com/downloads/xamarin
Post your comments below if you have any questions or feedback. We are happy to offer any help we can!
If you like this blog post, we think you’ll also like the following free e-books:


