TL;DR: Build an Awesome Photo Viewer & Editor with .NET MAUI Preview 14!
Learn how to create a sleek photo viewer and editor app from scratch using .NET MAUI Preview 14. We’ll guide you through setting up your project in Visual Studio, adding intuitive menu options for file and editing tasks, and incorporating advanced features like cascading menus. Perfect for both beginners and seasoned developers, this tutorial will help you enhance your .NET MAUI applications with beautiful image displays and seamless navigation.
In many applications, we need to showcase data that changes over time. A real-time chart is handy for displaying dynamically changing data. By using charts, we can easily convey information and understand the current trends in the data.
Syncfusion Flutter Charts is a well-crafted charting widget for visualizing data. It contains a rich gallery of 30+ charts and graphs, ranging from line to financial charts, that cater to all charting scenarios. The Flutter Charts also allows you to display live data that changes in minutes or even seconds.
This blog is a complete guide to updating and visualizing live data in your applications using Syncfusion Flutter Charts for:
Methods
In Flutter Charts, we can use either of the following techniques to update the chart data points live:
- Call the setState() method.
- Use the updateDataSource() method of the ChartSeriesController class.
The setState() method will completely process the chart again. The updateDataSource() method will process only the modified item in the data source, and based on that, the corresponding series will be redrawn.
Thus, if you have a vast amount of chart data, we suggest using the updateDataSource() method instead of the setState() method for better performance.
Updating data points
In this section, we will learn how to modify, add, and remove data points from the Flutter Charts data source.
Update the values of data points
To update the value of data points, re-initialize the data source collection and use the setState() method.
In the following example, we have called the setState() method in the onPressed event of a button.
/// Specifies the list of chart sample data.
List<ChartSampleData> chartData = <ChartSampleData>[
  ChartSampleData(x: 1, y: 30),
  ChartSampleData(x: 3, y: 13),
  ChartSampleData(x: 5, y: 80),
  ChartSampleData(x: 7, y: 30),
  ChartSampleData(x: 9, y: 72)
];

/// Creates an instance of random to generate the random number.
final Random random = Random();

@override
Widget build(BuildContext context) {
  return Scaffold(
    body: Center(
      child: Container(
        child: SfCartesianChart(
          primaryXAxis: NumericAxis(),
          primaryYAxis: NumericAxis(),
          series: <ColumnSeries<ChartSampleData, num>>[
            ColumnSeries<ChartSampleData, num>(
              dataSource: chartData,
              xValueMapper: (ChartSampleData data, _) => data.x,
              yValueMapper: (ChartSampleData data, _) => data.y,
              dataLabelSettings: DataLabelSettings(isVisible: true)
            ),
          ],
        )
      ),
    ),
    floatingActionButton: FloatingActionButton(
      onPressed: () => setState(() {
        chartData = <ChartSampleData>[];
        chartData = _getChartData();
      }),
      child: const Icon(Icons.refresh, color: Colors.white),
    )
  );
}

/// Get the random value.
num _getRandomInt(int min, int max) {
  return min + random.nextInt(max - min);
}

/// Method to update the chart data.
List<ChartSampleData> _getChartData() {
  chartData.add(ChartSampleData(x: 1, y: _getRandomInt(10, 100)));
  chartData.add(ChartSampleData(x: 3, y: _getRandomInt(10, 100)));
  chartData.add(ChartSampleData(x: 5, y: _getRandomInt(10, 100)));
  chartData.add(ChartSampleData(x: 7, y: _getRandomInt(10, 100)));
  chartData.add(ChartSampleData(x: 9, y: _getRandomInt(10, 100)));
  return chartData;
}
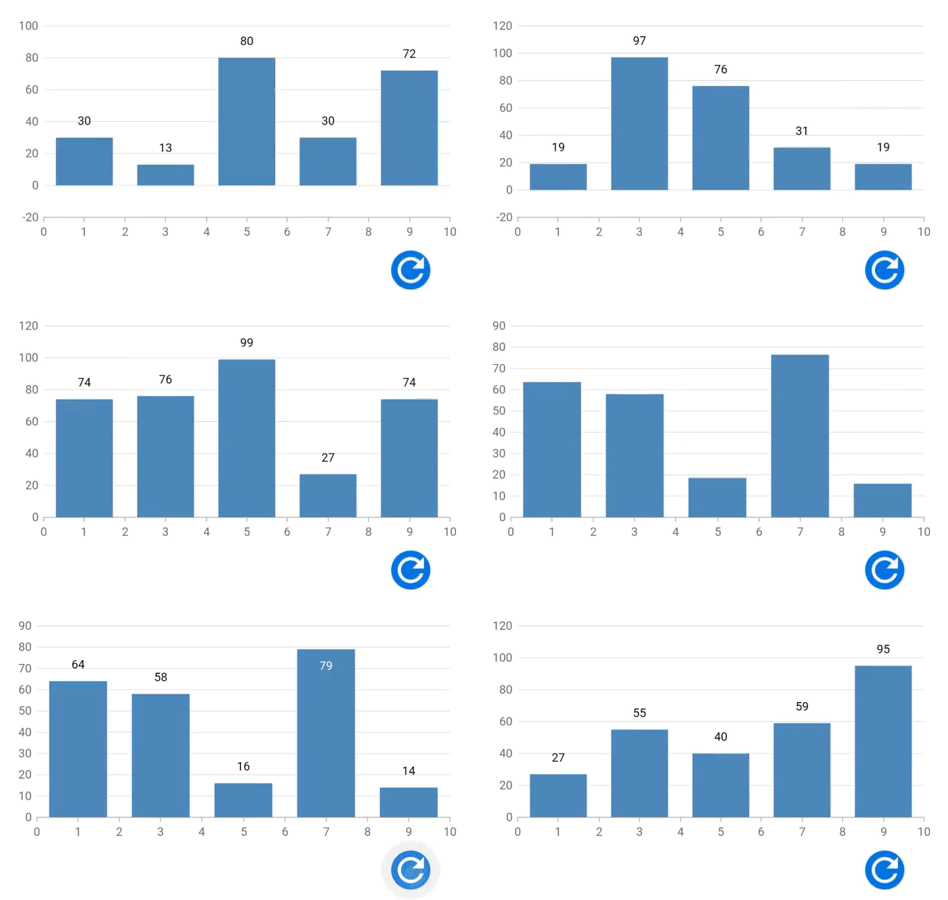
For more information, refer to the Updating the Existing Flutter Chart Data Point Value project demo.
Add and remove data points
To proceed further, read about how to use the updateDataSource() method to update the data source of the Flutter Charts.
Add data point
Now, follow these steps to add a data point to the existing data source collection and update it live in the Flutter Charts.
Step 1: Add a desired data point to the existing chart data.
List<ChartSampleData> _addDataPoint() {
  final int length = chartData.length;
  chartData.add(ChartSampleData(x: length, y: _getRandomInt(10, 100)));
  return chartData;
}
Step 2: Call the updateDataSource() method in the ChartSeriesController class. Assign the newly added index position to addedDataIndexes.
Refer to the following code example.
IconButton(
  onPressed: () {
    chartData = _addDataPoint();
    _chartSeriesController?.updateDataSource(
      addedDataIndexes: <int>[chartData.length - 1],
    );
  },
);
Remove data points
Let’s follow these steps to remove the Flutter Chart data points from the existing collection by calling the updateDataSource() of the ChartSeriesController class.
Step 1: Remove the unwanted data point from the chart’s datasource.
/// Remove the data point from the series.
List<ChartSampleData> _removeDataPoint() {
  if (chartData.isNotEmpty) {
    chartData.removeAt(chartData.length - 1);
  }
  return chartData;
}
Step 2: Then, call the updateDataSource() method of the ChartSeriesController class by assigning the removed index position to updatedDataIndexes and removedDataIndexes.
Refer to the following code example.
IconButton(
  onPressed: () {
    if (chartData.length > 1) {
      chartData = _removeDataPoint();
      _chartSeriesController?.updateDataSource(
        updatedDataIndexes: <int>[chartData.length - 1],
        removedDataIndexes: <int>[chartData.length - 1],
      );
    }
  },
)
Note: In both the add and remove data points code examples, the chartData is the data point collection set to the data source property of the chart at loading time.
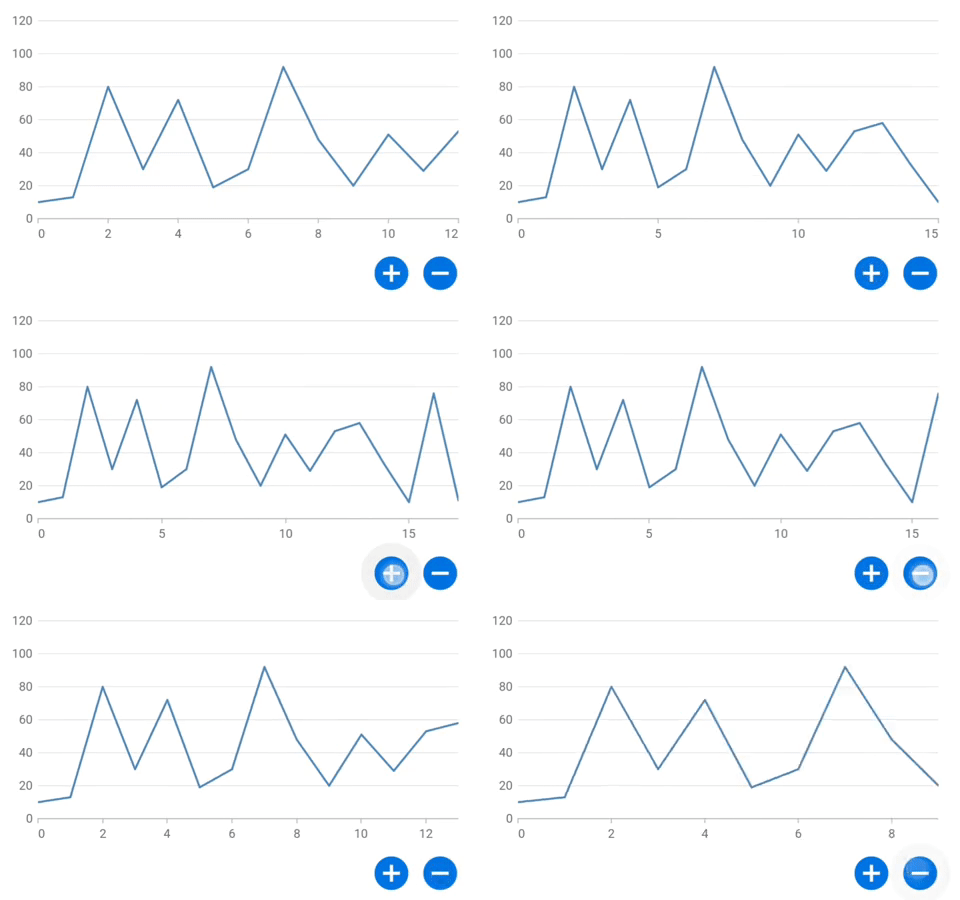
For more information, refer to the Adding/Removing Data Points in the Flutter Charts project demo.
Updating series
Let’s see how to add or remove a series from the series collection of a chart using the setState() method.
Add series
Step 1: Add the series to the existing series collection of Flutter Chart.
/// Add series into the chart.
void addSeries() {
  final List<ChartSampleData> chartData1 = <ChartSampleData>[];
  for (int i = 0; i <= 6; i++) {
    chartData1.add(ChartSampleData(x: i, y: _getRandomInt(10, 50)));
  }
  series.add(LineSeries<ChartSampleData, int>(
    key: ValueKey<String>('${series.length}'),
    dataSource: chartData1,
    xValueMapper: (ChartSampleData sales, _) => sales.x as int,
    yValueMapper: (ChartSampleData sales, _) => sales.y,
  ));
}
Step 2: Then, call the addSeries() method using the setState() in the onPressed event of a button to update the chart with the newly added series.
Refer to the following code example.
IconButton(
  icon: Icon(Icons.add_circle, size: 50),
  onPressed: () {
    setState(() {
      addSeries();
    });
  }
)
Remove series
Step 1: Remove the unwanted series from the Flutter Charts series collection.
///Remove the series from the chart.
void removeSeries() {
  if (series.isNotEmpty) {
    series.removeLast();
  }
}
Step 2: In the onPressed event of a button, call the removeSeries() method using the setState() method to update the removed series.
IconButton(
  icon: Icon(Icons.remove_circle, size: 50),
  onPressed: () => setState(() {
    removeSeries();
  }),
)
Note: In both the add and remove series examples, the series is the collection of series assigned to the series property of the Flutter Charts widget.
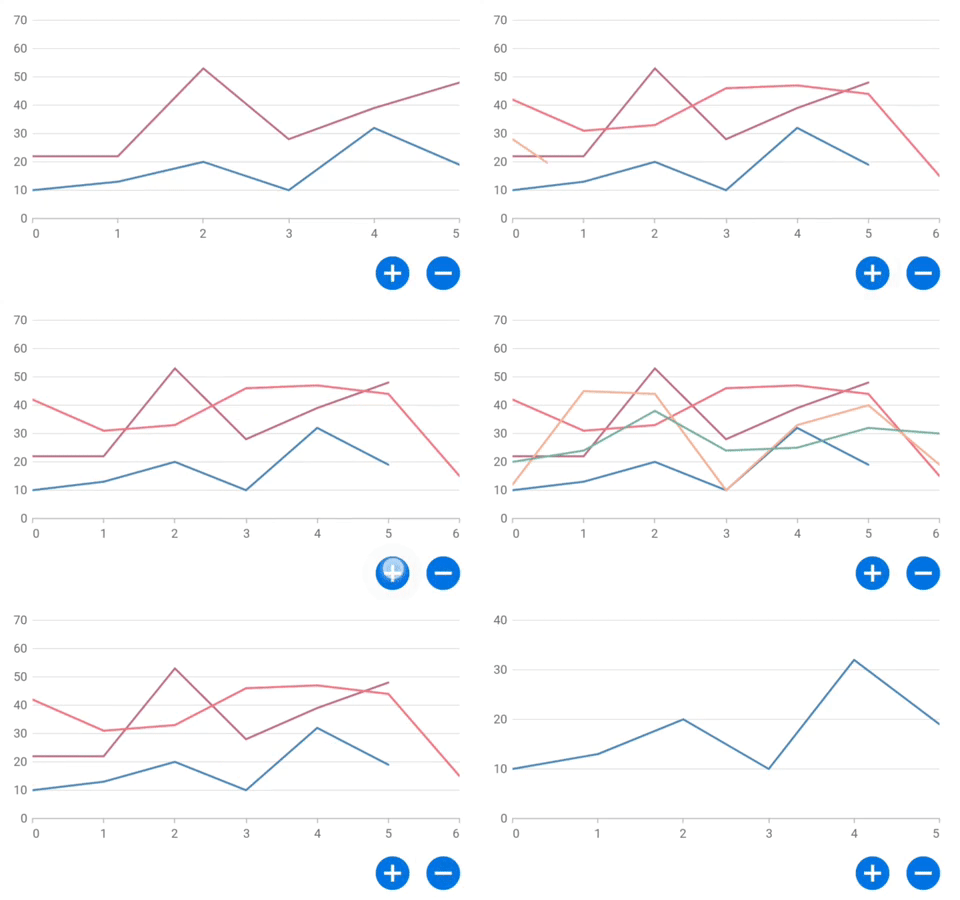
For more information, refer to the Add/Remove Series Dynamically in a Flutter Chart project demo.
Updating data on demand
In this section, we will see how to update the Flutter Charts data automatically at certain intervals and on user interaction.
Updating data at regular intervals
The Syncfusion Flutter Chart widget acts as a real-time chart that can be easily updated regularly. To achieve this, we are going to use the updateDataSource() method of the ChartSeriesController:
Step 1: Perform the required activities, such as adding or removing data points in the Chart data source, as explained in the previous section. Then, use the updateDataSource() to update the chart based on the new data point.
/// Continuously updating the data source based on timer.
void _updateDataSource(Timer timer) {
  chartData.add(_ChartData(count, _getRandomInt(10, 100)));
  if (chartData.length == 20) {
    chartData.removeAt(0);
    _chartSeriesController?.updateDataSource(
      addedDataIndexes: <int>[chartData.length - 1],
      removedDataIndexes: <int>[0],
    );
  } else {
    _chartSeriesController?.updateDataSource(
      addedDataIndexes: <int>[chartData.length - 1],
    );
  }
  count = count + 1;
}
Step 2: Then initialize a periodic timer. In the timer event, call the updateDataSource method to update the chart data continuously at a specific time interval.
Refer to the following code example.
Timer? timer;

@override
void initState() {
  super.initState();
  timer = Timer.periodic(const Duration(milliseconds: 100), _updateDataSource);
}
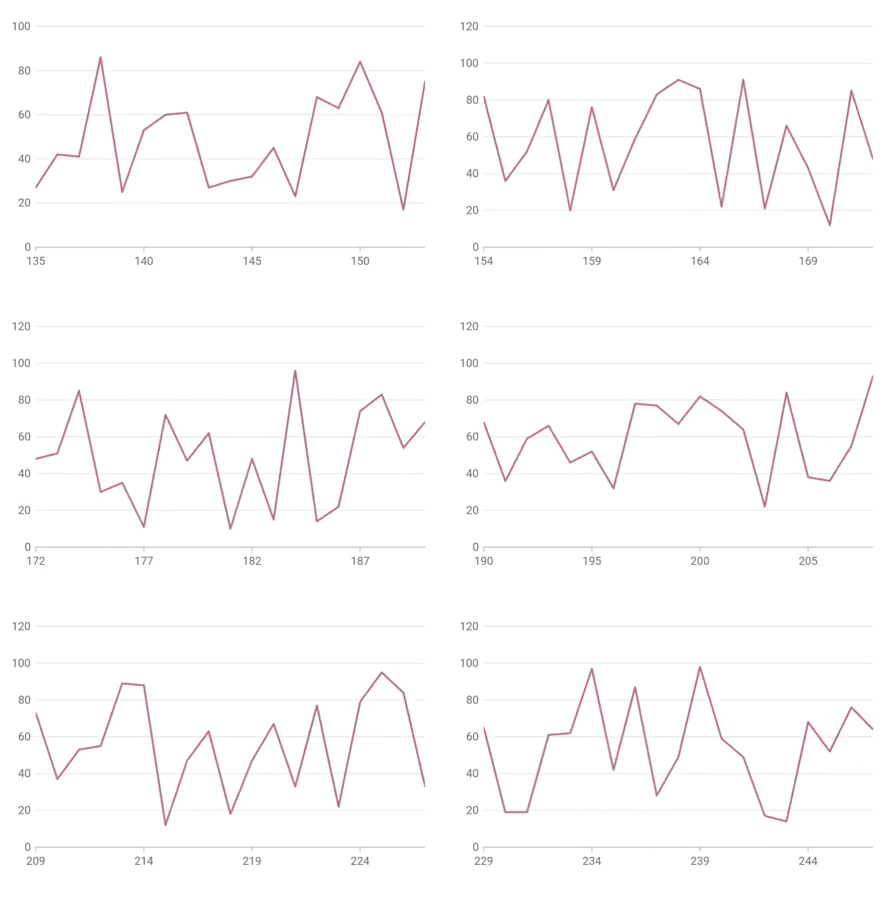
For more information, refer to the Updating Live Data On-Time in Flutter Line Charts project demo.
On interaction
This section explains how to dynamically update the Flutter Charts live data based on user interaction (dragging and tapping).
On drag
Before proceeding, refer to the On-demand loading in Flutter Cartesian Charts documentation.
Now, let’s see how to update the Flutter chart’s visible data points by dragging them into the chart area.
Here, we are going to load data on demand when the visible axis range reaches its end while dragging using the loadMoreIndicatorBuilder property of the Flutter Charts widget:
Step 1: Enable the enablePanning property of the ZoomPanBehavior class to perform dragging in the chart area.
Step 2: Next, create a widget to load more data when the axis visible range reaches the end while dragging.
Step 3: Return a circular progress indicator until the updated data is displayed in the chart.
Refer to the following code example.
/// Returns the load more indicator builder.
Widget getloadMoreIndicatorBuilder(
  BuildContext context, ChartSwipeDirection direction) {
    if (direction == ChartSwipeDirection.end) {
      isNeedToUpdateView = true;
      globalKey = GlobalKey<State>();
      return StatefulBuilder(
        key: globalKey,
        builder: (BuildContext context, StateSetter stateSetter) {
          Widget widget;
          if (isNeedToUpdateView) {
            widget = getProgressIndicator();
            _updateView();
            isDataUpdated = true;
          } else {
            widget = Container();
          }
          return widget;
        });
    } else {
      return SizedBox.fromSize(size: Size.zero);
    }
  }
)
Step 4: As discussed earlier, to update and show the newly added data indexes in the chart, use the updateDataSource() method of the ChartSeriesController class.
/// Update the chart view based on the newly added data points.
  Future<void> _updateView() async {
    await Future<void>.delayed(const Duration(seconds: 1), () {
      isNeedToUpdateView = false;
      if (isDataUpdated) {
        _updateData();
        isDataUpdated = false;
      }
      if (globalKey.currentState != null) {
        (globalKey.currentState as dynamic).setState(() {});
      }
    });
  }

  /// Method to add new data points to the chart source.
  void _updateData() {
    for (int i = 0; i < 4; i++) {
      chartData.add(ChartSampleData(
          xValue: chartData[chartData.length - 1].xValue + 1,
          y: getRandomInt(0, 600)));
    }
    isLoadMoreView = true;
    seriesController?.updateDataSource(addedDataIndexes: getIndexes(4));
  }

  /// Returns the newly added index values.
  List<int> getIndexes(int length) {
    final List<int> indexes = <int>[];
    for (int i = length - 1; i >= 0; i--) {
      indexes.add(chartData.length - 1 - i);
    }
    return indexes;
  }
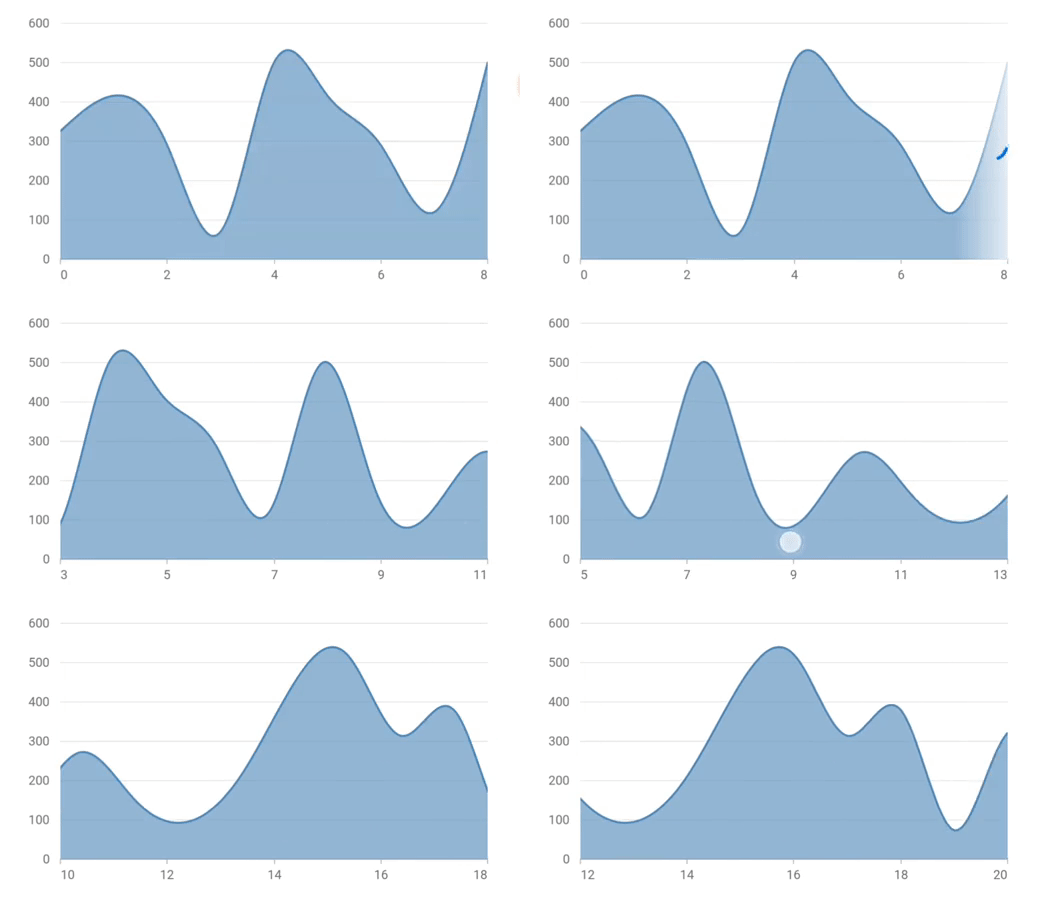
For more information, refer to the Infinite Scrolling in Flutter Charts project demo.
On tap
In this section, I will show you how to draw a chart series at a tapped point from the last data point of the chart series. To achieve this, we will use the onChartTouchInteractionUp to get the tapped position on the chart area. To convert a logical pixel value to a chart point value, use the pixelToPoint method of the ChartSeriesController class.
Refer to the following code example.
onChartTouchInteractionUp: (ChartTouchInteractionArgs args) {
  final Offset value = Offset(args.position.dx, args.position.dy);
  CartesianChartPoint<dynamic> chartpoint;
  chartpoint = seriesController!.pixelToPoint(value);
  chartData.add(ChartSampleData(x: chartpoint.x, y: chartpoint.y));
  setState(() {});
}
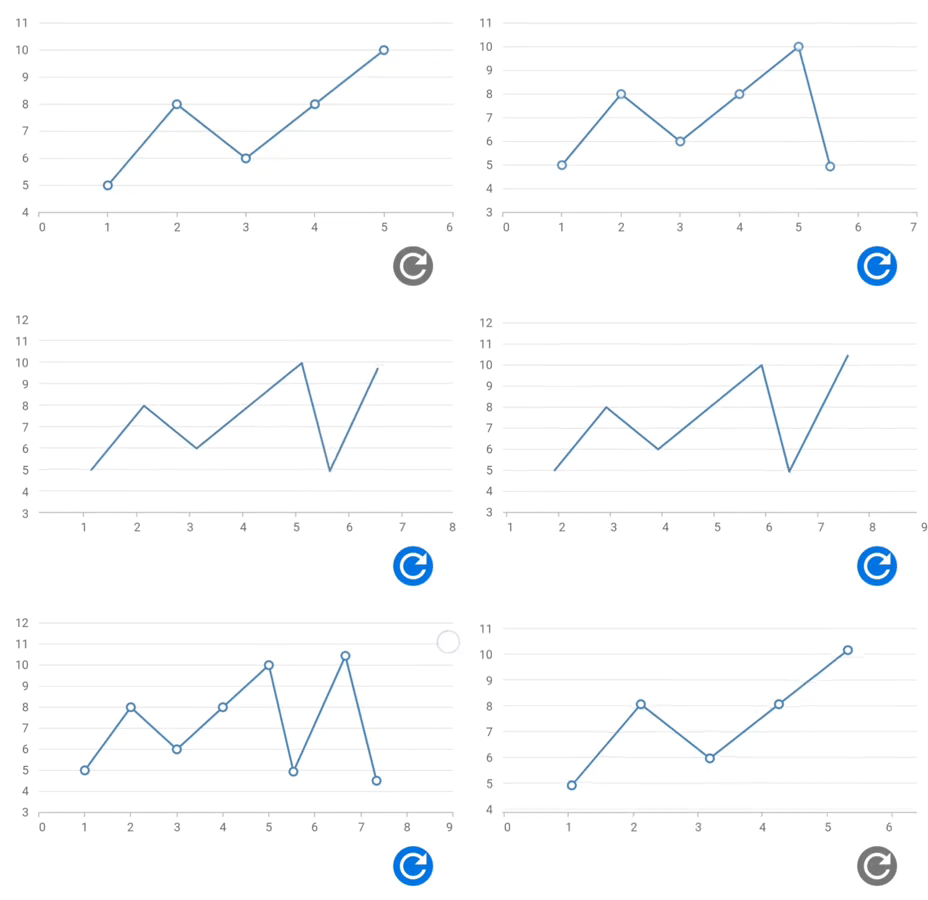
For more information, refer to the Adding Point On-Click in the Flutter Cartesian Charts project demo.
Pagination
Also, you can achieve pagination in the Flutter Charts with the onPlotAreaSwipe property. This will help you easily navigate to the desired data in a chart.
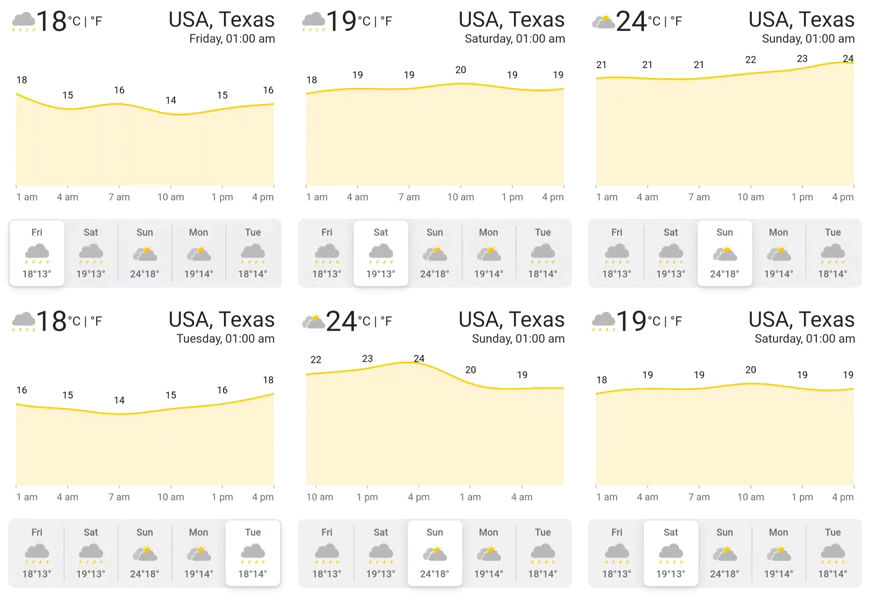
For more information, refer to the Pagination in the Flutter Charts demo.
Conclusion
Thanks for reading! In this blog post, we have seen how to update the live data in your real-time application using the Syncfusion Flutter Charts widget. Try out the steps in this blog post and enjoy hassle-free live updates in your real-time charts.
Browse our documentation to learn more about Syncfusion Flutter widgets. You can also see our Syncfusion Flutter app with many examples in this GitHub repository. Don’t miss our demo app in Google Play, App Store, the web, Windows Store, macOS, and Snapcraft (Linux).
If you aren’t a customer, try our 30-day free trial to check out our Flutter features.
Finally, if you wish to send us feedback or would like to submit any questions, please feel free to post them in the comments section of this blog post. You can also contact us through our support forums, feedback portal, or Direct-Trac support system. We are always happy to assist you!





Comments (7)
Hi, thanks but what if I want to prepend data (not append)? I make something like this
““
data.insert(0, newData);
seriesController.updateDataSource(addedDataIndexes: List.generate(newData.length, (i) => i));
““
and as a result I have exception
Error: RangeError (index): Index out of range: index must not be negative: -1
at Object.throw_ [as throw] (http://localhost:53931/dart_sdk.js:5067:11)
at Array.[dartx._get] (http://localhost:53931/dart_sdk.js:17485:21)
at datetime_category_axis.DateTimeCategoryAxisRenderer.new.generateVisibleLabels (http://localhost:53931/packages/syncfusion_flutter_charts/src/circular_chart/renderer/pie_series.dart.lib.js:62632:92)
at datetime_category_axis.DateTimeCategoryAxisDetails.new.calculateRangeAndInterval (http://localhost:53931/packages/syncfusion_flutter_charts/src/circular_chart/renderer/pie_series.dart.lib.js:62776:29)
What to do to make it work with DateTimeCategoryAxis? because I get error like below; it is only for this DateTimeCategoryAxis, for DateTimeAxis it works well
Error: RangeError (index): Index out of range: index must not be negative: -1
at Object.throw_ [as throw] (http://localhost:61697/dart_sdk.js:5067:11)
at Array.[dartx._get] (http://localhost:61697/dart_sdk.js:17485:21)
at datetime_category_axis.DateTimeCategoryAxisRenderer.new.generateVisibleLabels (http://localhost:61697/packages/syncfusion_flutter_charts/src/circular_chart/renderer/pie_series.dart.lib.js:62632:92)
at datetime_category_axis.DateTimeCategoryAxisDetails.new.calculateRangeAndInterval (http://localhost:61697/packages/syncfusion_flutter_charts/src/circular_chart/renderer/pie_series.dart.lib.js:62776:29)
Hi Witold,
We regret for the inconvenience caused. The reported issue could be replicated at our end and we will resolve this at the earliest. The fix for this issue will be rolled out in our next weekly patch release which is expected on 29th March 2022. We appreciate your patience until then.
Regards,
Yuvaraj.
Hi Witold,
Thanks for being patience, the reported scenario has been resolved. To resolve this at your end, kindly upgrade your chart package to the latest version below.
https://pub.dev/packages/syncfusion_flutter_charts/versions/20.1.47+1
Thanks,
Dharani.
Hi,
I get the following exception when trying to implement something similar to your ‘Update data on demand’ example.
Invalid value – Not in inclusive range 1..103
It’s thrown from the SelectionRenderer::IsSeriesContainsPoint method (line 1530 in my version of the lib which is 20.1.47).
It looks to me like one of the ‘nearestDataPoints’ found is no longer in the seriesRendererDetails.dataPoints array and. The ‘indexOf’ method then returns -1 and the exception is thrown.
Looking at the data at the time of the exception, I’d guess the point that was removed from my underlying data source is, for some reason, not removed from the nearestDataPoints object.
The part of my code that tries to mimic your example looks as:
//update data source
_dataPoints.add(_ChartData(_sensor.sampleNr, sample));
if (_dataPoints.length >= _nofPointsActive) {
_dataPoints.removeAt(0);
_chartSeriesController?.updateDataSource(
addedDataIndex: _dataPoints.length – 1, removedDataIndex: 0);
} else {
_chartSeriesController?.updateDataSource(
addedDataIndex: _dataPoints.length – 1);
}
If you could shed some light on this, I’d be happy 🙂
Regards
/Anders
Hi Anders,
Greetings from Syncfusion. We have analyzed and tried to replicate the issue that you have mentioned but, we were unable to replicate your scenario. You have made use of a variable called _noOfPointsActive. We have no idea of what values you used on that. However, we have ensured with other features like selection, different types of series. Since we are not aware of your exact scenario, kindly get back to us by replicating your scenario with the provided sample. It will be helpful in providing you with a solution sooner.
Sample: https://www.syncfusion.com/downloads/support/directtrac/general/ze/load_on_demand1246112180
Regards,
Marismathan G
Hi again,
Currently, I can not give you a complete example, sorry.
After some more testing, I believe that this is caused by a race condition between the code that updates the backing data set and the code that handles pointer input when hovering over the graph eg with the mouse pointer. Do you have a better support channel than this blog?
Steps to repeat:
1. Produce a graph that updates the values in ‘realtime’ by updating the backing data set. Make sure that the graph ‘moves’ from right to left, that is remove stuff at index 0 and add at the end.
2. Make sure that the mouse pointer is not in the window where the graph is running
3. Everything should be running fine.
4. Move the mouse pointer to the area close to the left end of the graph (near where index 0 is rendered)
5. Watch it explode.
With Linux desktop as target, the below is an example of a stacktrace from the above sequence. With the web as target, I get exceptions thrown but the browser seem to swallow them and the application continues.
═════ Exception caught by gesture library ═══════════════════════════════════
The following RangeError was thrown while dispatching a pointer event:
RangeError (index): Invalid value: Not in inclusive range 0..103: -1
When the exception was thrown, this was the stack
#0 List.[] (dart:core-patch/growable_array.dart:281:36)
#1 SelectionRenderer.isSeriesContainsPoint
package:syncfusion_flutter_charts/…/user_interaction/selection_renderer.dart:1530
#2 ContainerArea._findSeries
package:syncfusion_flutter_charts/…/base/chart_base.dart:3090
#3 ContainerArea._performMouseHover
package:syncfusion_flutter_charts/…/base/chart_base.dart:3885
#4 ContainerArea.build..
package:syncfusion_flutter_charts/…/base/chart_base.dart:2339
#5 RenderMouseRegion.handleEvent
package:flutter/…/rendering/proxy_box.dart:2973
#6 GestureBinding.dispatchEvent
package:flutter/…/gestures/binding.dart:419
#7 RendererBinding.dispatchEvent
package:flutter/…/rendering/binding.dart:322
#8 GestureBinding._handlePointerEventImmediately
package:flutter/…/gestures/binding.dart:374
#9 GestureBinding.handlePointerEvent
package:flutter/…/gestures/binding.dart:338
#10 GestureBinding._flushPointerEventQueue
package:flutter/…/gestures/binding.dart:296
#11 GestureBinding._handlePointerDataPacket
package:flutter/…/gestures/binding.dart:279
#15 _invoke1 (dart:ui/hooks.dart:170:10)
#16 PlatformDispatcher._dispatchPointerDataPacket (dart:ui/platform_dispatcher.dart:331:7)
#17 _dispatchPointerDataPacket (dart:ui/hooks.dart:94:31)
(elided 3 frames from dart:async)
Event: PointerHoverEvent#147bb(position: Offset(46.2, 433.0))
position: Offset(46.2, 433.0)
Target: RenderMouseRegion#8cfef
needs compositing
parentData: (can use size)
constraints: BoxConstraints(w=1260.0, h=280.0)
size: Size(1260.0, 280.0)
listeners: hover, exit
════════════════════════════════════════════════════════════════════════════════