The Server-side engine in our JavaScript Pivot Table is a .NET Library called Syncfusion.EJ2.Pivot.dll. It takes flat data, such as JSON, CSV, DataTable, and collections as an input, and represents it in a multi-dimensional format based on the report we specify. You can integrate the server-side pivot engine into your application by downloading the Syncfusion.EJ2.Pivot NuGet package.
Why should we use the server-side engine?
In general, a pivot table needs all of the raw data to do the pivot calculations. If the raw data is in a server, then we have to transfer it to the browser in order to feed it to the Pivot Table component.
If the size of the raw data is huge, then it will increase the network traffic, which will lead to some delays and the browser page might be killed. So, the data size directly affects the rendering performance of the Pivot Table component. It will further affect the user’s actions because the browser hangs while presenting a huge amount of data.
On the other hand, in the server-side engine, all pivot calculations such as filtering, sorting, aggregation, etc. are done on the server-side, and only the information that we want to display in the viewport on the client-side will be passed from the server. This prevents transferring the entire data source to a browser, reduces network traffic, and increases the rendering performance of the Pivot Table, especially where there are millions of data records. It works best while virtual scrolling.
How to use the server-side engine in JavaScript Pivot Table?
Follow these steps to use the server-side engine in the JavaScript Pivot Table:
Download and install the server-side pivot engine
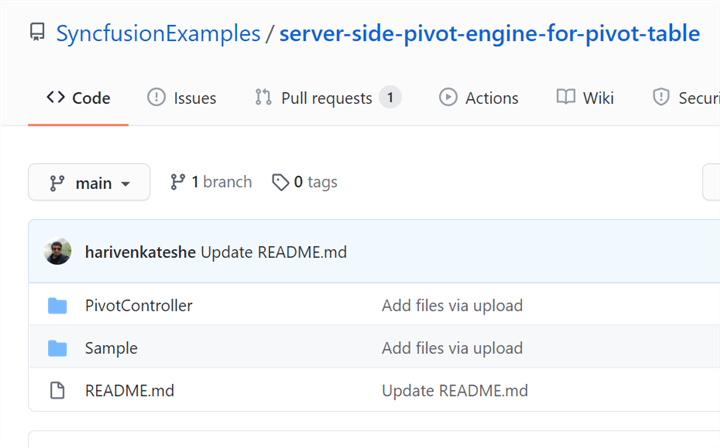
- First, download the ASP.NET Core application (server) and a stand-alone Pivot Table sample from this GitHub repository.
Refer to the following screenshot.
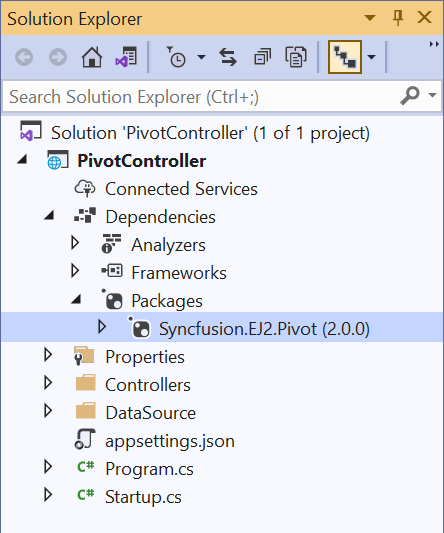
 The server-side application has the following files:
- PivotController.cs file under the Controllers folder, helps in data communication with Pivot Table.
- DataSource.cs file under the DataSource folder, has model classes that define the structure of the data sources.
- Also, the sales.csv and sales-analysis.json data source files are placed under the DataSource folder.
- Then, open the PivotController app in the Visual Studio where the Syncfusion.EJ2.Pivot library will be downloaded automatically from NuGet.

Connecting the JavaScript Pivot Table to the server app
- Now, run the server application which will be hosted in IIS (Internet Information Services).
- Then, in the Pivot Table sample, set the mode property under the dataSourceSettings as Server and map the URL of the hosted server application in the url property of the dataSourceSettings.
Refer to the following code.let pivotObj: PivotView = new PivotView({ dataSourceSettings: { url: 'http://localhost:61379/api/pivot/post', mode: 'Server' //Codes here. } }); - Frame the report based on the data source connection in the server application.
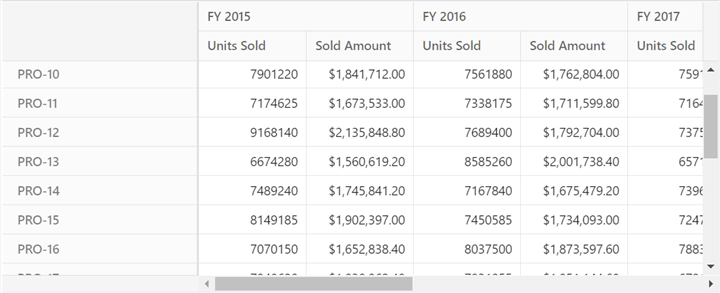
let pivotObj: PivotView = new PivotView({ dataSourceSettings: { url: 'http://localhost:61379/api/pivot/post', mode: 'Server', rows: [{ name: 'ProductID', caption: 'Product ID' }], formatSettings: [{ name: 'Price', format: 'C' }], columns: [{ name: 'Year', caption: 'Production Year' }], values: [ { name: 'Sold', caption: 'Units Sold' }, { name: 'Price', caption: 'Sold Amount' } ], } //Codes here. }); - Finally, run the sample. Your output will look like the following screenshot.

Supported data sources
The server-side engine supports the following data sources:
- Collection
- JSON
- CSV
- DataTable
- Dynamic
How does the server-side engine work?
On every action in the JavaScript Pivot Table, the updated report will be sent to the server-side, which generates the engine and returns it to the client-side. Then, the JavaScript Pivot Table will refresh based on the updated engine.
In our server app, we use the memory cache option to store the data source and engine properties in the RAM which will be utilized for UI operations. This restricts the execution of all the initial rendering code to generate the aggregated values during each UI operation. Thereby, improving the performance of the JavaScript Pivot Table.
The following code illustrates how we use the memory cache option in the GetEngine method to store the engine properties.
public async Task<EngineProperties> GetEngine(FetchData param)
{
   isRendered = false;
   // Engine properties are stored in memory cache with GUID "parem.Hash".
   return await _cache.GetOrCreateAsync("engine" + param.Hash,
      async (cacheEntry) =>
      {
          isRendered = true;
          cacheEntry.SetSize(1);
          // Memory cache expiration time can be set here.
          cacheEntry.AbsoluteExpiration = DateTimeOffset.UtcNow.AddMinutes(60);
          PivotEngine.Data = await GetData(param);
          return await PivotEngine.GetEngine(param);
      });
}
Here, we store the engine properties as a cache with the unique ID (GUID) in RAM which is transferred from the client-side source. The server-side engine generates the GUID randomly, which will change when refreshing the page or opening a new tab or window. So, the memory cache of each GUID holds unique information and the component works independently.
Here, we set the memory cache to expire from the RAM after 60 minutes in order to free its memory. If the component is still running, it will generate the information again and store it for another 60 minutes.
Limitations
Usually, we use virtual scrolling to handle a large volume of data. In such cases, the limitations of virtual scrolling are applicable for the server-side engine as well. The limitations are:
- Resizing columns, setting the width to individual columns, and enabling text-wrap operations affect the pivot calculation used to pick the correct page on scrolling.
- Grouping takes additional time to split the raw items in the provided format.
- Date formatting takes additional time to convert the existing date format.
- Date formatting with sorting additionally frames the full date-time format to perform sorting along with the provided date format. This may lead to a lag in performance.
There is one additional limitation:
- We are storing the memory cache in RAM, and the memory will be allocated for each user separately who is accessing the server-side engine. So, there is a change of getting a memory exception when multiple users simultaneously access the server. It depends on the size of the data source they are bound to and the amount of RAM in the server.
Conclusion
Thanks for reading! In this blog, we have seen the usage of the server-side engine in the JavaScript Pivot Table component, how it works, and the steps to configure it in your app. This results in less bandwidth and more efficient performance. So, try out the steps provided in this blog post and leave your feedback in the comments section!
Our Pivot Table is also available in our Blazor, ASP.NET (Core, MVC, Web Forms), JavaScript, Angular, React, and Vue component suites. Use it to elegantly organize and summarize business data in any application!
For existing customers, the newest version is available for download from the License and Downloads page. If you are not yet a Syncfusion customer, you can try our 30-day free trial to check out the available features. Also, you can try our samples on GitHub.
You can also contact us through our support forums, Direct-Trac, or feedback portal. We are always happy to assist you!
