TL;DR: Let’s use the Syncfusion .NET MAUI Scatter Chart to visualize the sizes and weights of various sports balls and highlight their differences. This blog guides you through gathering data, preparing it, configuring the chart, and customizing its appearance and interactivity. Explore the GitHub demo for more details.
Welcome to our Chart of the Week blog series!
Today, we’ll visualize the sizes and weights of various sports balls using the Syncfusion .NET MAUI Scatter Chart.
Sports enthusiasts know that most sports use balls, which vary widely in size and weight. Understanding these variations can provide fascinating insights into the design and dynamics of each sport. The lightest ball is a Table Tennis ball, and the largest ball size is Basketball. These differences reflect each sport’s unique demands and rules, providing a deeper appreciation for their diversity.
The Syncfusion .NET MAUI Scatter Chart is ideal for showcasing these differences. A scatter chart plots data points on a two-dimensional graph, making it easy to observe relationships between variables. The chart’s feature set includes data binding, tooltips, titles, and customizable axes, ensuring a clear and engaging visualization.
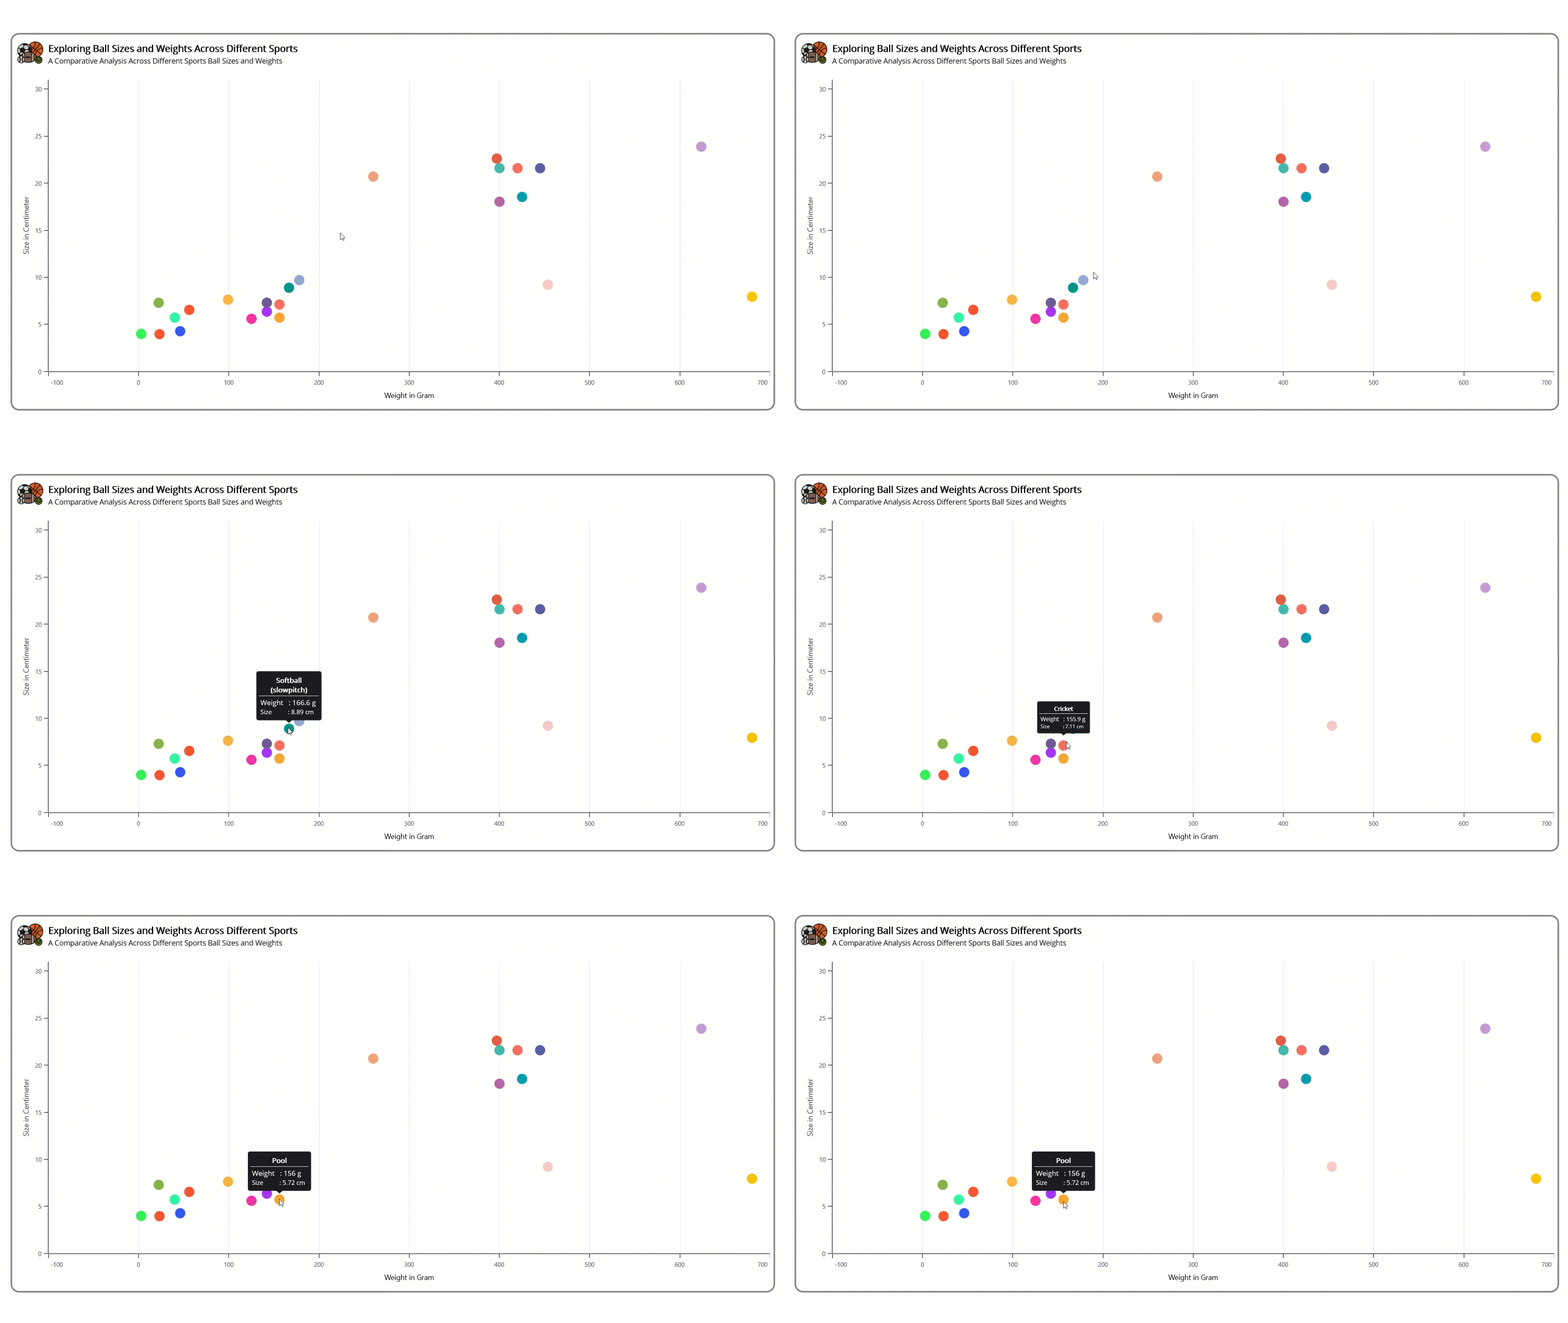
The following image shows the scatter chart we are going to create.
Step 1: Gathering the data
First, we need to gather information from the topend sports. We require data on ball Sizes and weights.
Step 2: Prepare the data for the chart
Create a SportsBallModel class to define the structure of our sports ball data and a SportsBallViewModel class to handle the data manipulation and communication between the model and the scatter chart.
First, define the SportsBallModel class with the following properties:
- Name: Denotes the name of the sports ball, indicating the specific type or variant it represents.
- Size: Describes the dimensions of the sports ball, specifying its diameter.
- Weight: Quantifies the mass of the sports ball, measured in units such as grams.
Refer to the following code example.
public class SportsBallModel
{
    public string Name { get; set; }
    public double Size { get; set; }
    public double Weight { get; set; }

    public SportsBallModel(string name, double size, double weight)
    {
        Name = name;
        Size = size;
        Weight = weight;
    }
}
Next, create the SportsBallViewModel class. It acts as an intermediary between the data models and user interface elements (scatter chart), preparing and formatting data for display and interaction.
Refer to the following code example.
public class SportsBallViewModel
{
    public List<SportsBallModel> SportsBallData { get; set; }

    public SportsBallViewModel()
    {

        SportsBallData = new List<SportsBallModel>();
        SportsBallData.Add(new SportsBallModel { Weight = 23, Size = 3.96, Name = "Squash" });
        SportsBallData.Add(new SportsBallModel { Weight = 2.7, Size = 3.99, Name = "Table Tennis" });
        SportsBallData.Add(new SportsBallModel { Weight = 45.93, Size = 4.27, Name = "Golf" });
        SportsBallData.Add(new SportsBallModel { Weight = 125, Size = 5.59, Name = "Jai Alai" });
        SportsBallData.Add(new SportsBallModel { Weight = 40, Size = 5.72, Name = "Racquetball" });
        SportsBallData.Add(new SportsBallModel { Weight = 156, Size = 5.72, Name = "Pool" });
        SportsBallData.Add(new SportsBallModel { Weight = 142, Size = 6.35, Name = "Lacrosse" });
        SportsBallData.Add(new SportsBallModel { Weight = 56.0, Size = 6.54, Name = "Tennis" });
        SportsBallData.Add(new SportsBallModel { Weight = 680, Size = 7.94, Name = "Pétanque" });
        SportsBallData.Add(new SportsBallModel { Weight = 155.9, Size = 7.11, Name = "Cricket" });
        SportsBallData.Add(new SportsBallModel { Weight = 156, Size = 7.11, Name = "Field Hockey" });
        SportsBallData.Add(new SportsBallModel { Weight = 142, Size = 7.30, Name = "Baseball" });
        SportsBallData.Add(new SportsBallModel { Weight = 22.1, Size = 7.29, Name = "Pickleball" });
        SportsBallData.Add(new SportsBallModel { Weight = 99, Size = 7.62, Name = "Polo" });
        SportsBallData.Add(new SportsBallModel { Weight = 166.6, Size = 8.89, Name = "Softball (slowpitch)" });
        SportsBallData.Add(new SportsBallModel { Weight = 453.6, Size = 9.21, Name = "Croquet" });
        SportsBallData.Add(new SportsBallModel { Weight = 178, Size = 9.70, Name = "Softball (fastpitch)" });
        SportsBallData.Add(new SportsBallModel { Weight = 920, Size = 10.67, Name = "Bocce" });
        SportsBallData.Add(new SportsBallModel { Weight = 400, Size = 18.03, Name = "Rhythmic gymnastics ball" });
        SportsBallData.Add(new SportsBallModel { Weight = 425, Size = 18.54, Name = "Team Handball" });
        SportsBallData.Add(new SportsBallModel { Weight = 260, Size = 20.70, Name = "Volleyball" });
        SportsBallData.Add(new SportsBallModel { Weight = 420, Size = 21.59, Name = "Football (Soccer)" });
        SportsBallData.Add(new SportsBallModel { Weight = 445, Size = 21.59, Name = "Korfball" });
        SportsBallData.Add(new SportsBallModel { Weight = 400, Size = 21.59, Name = "Water polo" });
        SportsBallData.Add(new SportsBallModel { Weight = 397, Size = 22.61, Name = "Netball" });
        SportsBallData.Add(new SportsBallModel { Weight = 623.7, Size = 23.88, Name = "Basketball" });
    }
}
Step 3: Configure the Syncfusion .NET MAUI Cartesian Charts
Let’s configure the .NET MAUI Cartesian Charts control using this documentation.
Refer to the following code example.
<chart:SfCartesianChart>

 <chart:SfCartesianChart.XAxes>
  <chart:CategoryAxis/>
 </chart:SfCartesianChart.XAxes>

 <chart:SfCartesianChart.YAxes>
  <chart:NumericalAxis/>
 </chart:SfCartesianChart.YAxes>

</chart:SfCartesianChart>
Step 4: Bind data to the .NET MAUI Scatter series
To display the sports ball data effectively, we’ll utilize the Syncfusion ScatterSeries instance and bind our SportsBallData collection to it. Each ball will be represented as a point on the chart, with its corresponding size and weight.
Refer to the following code example.
<chart:ScatterSeries XBindingPath="Weight"
                     YBindingPath="Size"
                     ItemsSource="{Binding SportsBallData}">
</chart:ScatterSeries>
We’ve bound the SportsBallData collection from the SportsBallViewModel to the ItemSource property. The XBindingPath and YBindingPath properties are bound to the Weight and Size properties.
Step 5: Customize the .NET MAUI Scatter Chart appearance
Let’s customize the appearance of the Syncfusion .NET MAUI Scatter Chart to enhance its readability.
Adding the chart title
Adding a title to the chart enhances its readability and aids users in understanding its content more effectively. By providing a clear and descriptive title, users can quickly grasp the purpose and context of the chart, making it more accessible and informative.
Refer to the following code example.
<chart:SfCartesianChart.Title>
 <Grid>
  <Grid.RowDefinitions>
   <RowDefinition Height="{OnPlatform Android=68,Default=80,iOS=68}"/>
  </Grid.RowDefinitions>
  <Grid.ColumnDefinitions>
   <ColumnDefinition Width="55"/>
   <ColumnDefinition Width="Auto"/>
  </Grid.ColumnDefinitions>
  <Image Grid.Column="0"
         Grid.RowSpan="2"
         Source="balls_sports.png"
         Margin="0,-25,0,0"
         HeightRequest="70"
         WidthRequest="50"/>
  <StackLayout Grid.Column="1"
               Grid.Row="0"
               Margin="7,7,0,0">
   <Label Text="Exploring Ball Sizes and Weights Across Different Sports"
          FontSize="{OnPlatform Android=12,Default=16,iOS=12}"
          FontAttributes="Bold"
          TextColor="Black"/>
   <Label Text="A Comparative Analysis Across Different Sports Ball Sizes and Weights"
          FontSize="{OnPlatform Android=10,Default=12,iOS=10}"
          TextColor="Black"
          Margin="0,2,0,0"/>
  </StackLayout>
 </Grid>
</chart:SfCartesianChart.Title>
Customize the axes
Let’s customize the X- and Y-axes with the Minimum, Maximum, EdgeLabelsDrawingMode, and ShowMajorGridLines properties and the axis Title, LineStyle, and TickStyle properties.
Refer to the following code example.
<chart:SfCartesianChart.XAxes>
    <chart:NumericalAxis ShowMajorGridLines="True"
                         Maximum="700"
                         Interval="100"
                         EdgeLabelsDrawingMode="Shift"
                         RangePadding="Additional">
        <chart:NumericalAxis.MajorTickStyle>
            <chart:ChartAxisTickStyle Stroke="Black"/>
        </chart:NumericalAxis.MajorTickStyle>
        <chart:NumericalAxis.AxisLineStyle>
            <chart:ChartLineStyle Stroke="Black"/>
        </chart:NumericalAxis.AxisLineStyle>
        <chart:NumericalAxis.Title>
            <chart:ChartAxisTitle Text="Weight in Gram" TextColor="Black"/>
        </chart:NumericalAxis.Title>
    </chart:NumericalAxis>
</chart:SfCartesianChart.XAxes>

<chart:SfCartesianChart.YAxes>
    <chart:NumericalAxis  EdgeLabelsDrawingMode="Center"
                          Maximum="31"
                          Minimum="0"
                          Interval="5"
                          ShowMajorGridLines="False">
        <chart:NumericalAxis.MajorTickStyle>
            <chart:ChartAxisTickStyle Stroke="Black"/>
        </chart:NumericalAxis.MajorTickStyle>
        <chart:NumericalAxis.AxisLineStyle>
            <chart:ChartLineStyle Stroke="Black"/>
        </chart:NumericalAxis.AxisLineStyle>
        <chart:NumericalAxis.Title>
            <chart:ChartAxisTitle Text="Size in Centimeter" Stroke="Black"/>
        </chart:NumericalAxis.Title>
    </chart:NumericalAxis>
</chart:SfCartesianChart.YAxes>
Customizing the Scatter series
Here, we will enhance the series appearance using the PaletteBrushes, PointHeight, and PointWidth properties.
Refer to the following code example.
<chart:ScatterSeries PaletteBrushes="{Binding PaletteBrushes}"
                     PointHeight="20"
                     PointWidth="20">
</chart:ScatterSeries>
Adding interactivity to the chart
Now, enable tooltips in the scatter series to enhance data visualization and provide additional insights. Customize the tooltip content to display relevant information, such as the name, size, and weight of a sports ball, that improves user experience by offering immediate, context-specific information and deeper data insights using the TooltipTemplate property.
Refer to the following code example.
<chart:ScatterSeries.TooltipTemplate>
    <DataTemplate>
        <Grid>
            <Grid.RowDefinitions>
                <RowDefinition Height="Auto"/>
                <RowDefinition Height="Auto"/>
                <RowDefinition Height="Auto"/>
            </Grid.RowDefinitions>
            <Grid.ColumnDefinitions>
                <ColumnDefinition Width="Auto"/>
            </Grid.ColumnDefinitions>
            <Label Grid.Row="0"
                   Grid.Column="0"
                   LineBreakMode="WordWrap"
                   MaximumWidthRequest="100"
                   Text="{Binding Item.Name,StringFormat='{0}'}"
                   HorizontalTextAlignment="Center"
                   HorizontalOptions="Center"
                   VerticalTextAlignment="Center"
                   FontAttributes="Bold"
                   Margin="0,3,0,3"
                   FontSize="13.5"
                   TextColor="White"/>
            <BoxView Grid.Row="1"
                     Grid.Column="0"
                     VerticalOptions="Center"
                     Color="White"
                     HeightRequest="1" />
            <StackLayout Grid.Row="2"
                         Grid.Column="0"
                         Orientation="Vertical"
                         VerticalOptions="Fill"
                         Spacing="0"
                         Padding="3"
                         Margin="0">
                <Label Text="{Binding Item.Weight,StringFormat='Weight: {0} g'}"
                       VerticalTextAlignment="Center"
                       HorizontalOptions="Start"
                       Margin="0,0,3,0"
                       FontSize="13.5"
                       TextColor="White"/>
                <Label Text="{Binding Item.Size,StringFormat='Size: {0} cm'}"
                       VerticalTextAlignment="Center"
                       HorizontalOptions="Start"
                       Margin="0,0,3,0"
                       FontSize="12"
                       TextColor="White"/>
            </StackLayout>
        </Grid>
    </DataTemplate>
</chart:ScatterSeries.TooltipTemplate>
After executing these code examples, we will get the output that resembles the following image.
GitHub reference
Use the .NET MAUI Scatter Chart GitHub demo to visualize different sports ball sizes and weights for more details.

Supercharge your cross-platform apps with Syncfusion's robust .NET MAUI controls.
Conclusion
Thanks for reading! In this blog, we’ve seen how to use the Syncfusion MAUI Scatter chart to visualize the different sports ball sizes and weights. We strongly encourage you to follow the steps outlined in this blog and share your thoughts in the comments below.
The existing customers can download the new version of Essential Studio® on the License and Downloads page. If you are not a Syncfusion customer, try our 30-day free trial to check out our incredible features.
You can also contact us through our support forums, support portal, or feedback portal. We are always happy to assist you!
